Courtesy of the credits on graphs from Mark Perry at Carpe Diem I found the mother lode of data for oil production in North Dakota.
Piece of cake to produce these cool graphs. Source of data: ND Monthly Oil Production Statistics
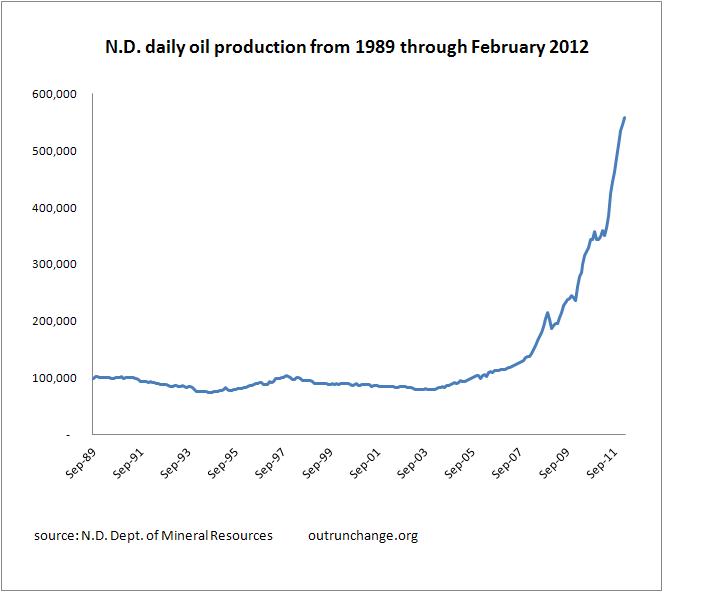
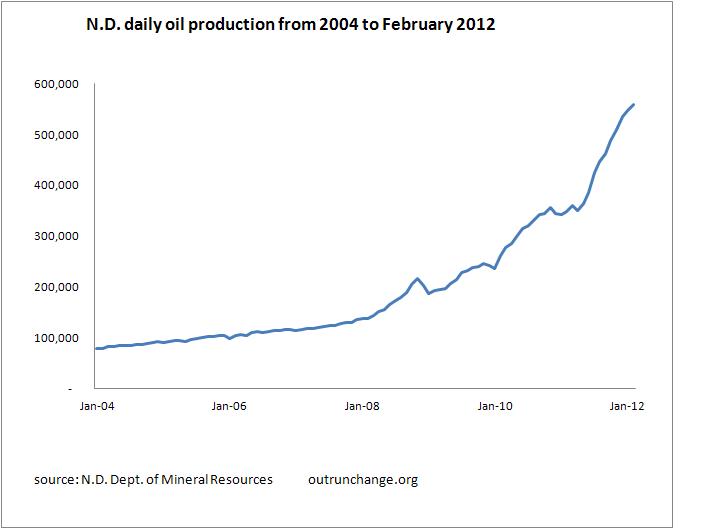
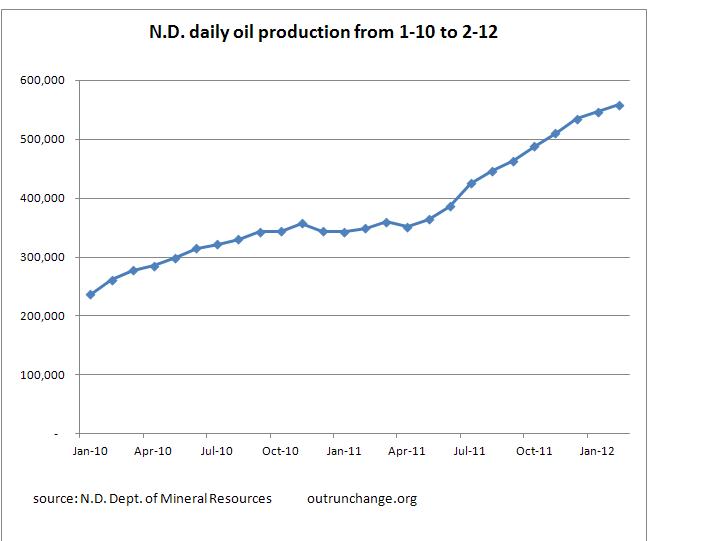
The following graphs show the daily production of oil in North Dakota. I’ve presented three time horizons, since that shows difference time perspectives.
Click to enlarge any of the graphs.


2 thoughts on “Daily production graphs of North Dakota oil”