I’ve been watching the tally of daily rig count for a while. When I think about it, I jot down the count listed at The Million Dollar Way blog. Occasionally, as in every few months, I post my tallies.
By the way, if you have even the slightest interest in my comments on my blog you really, really, really need to read MDW.
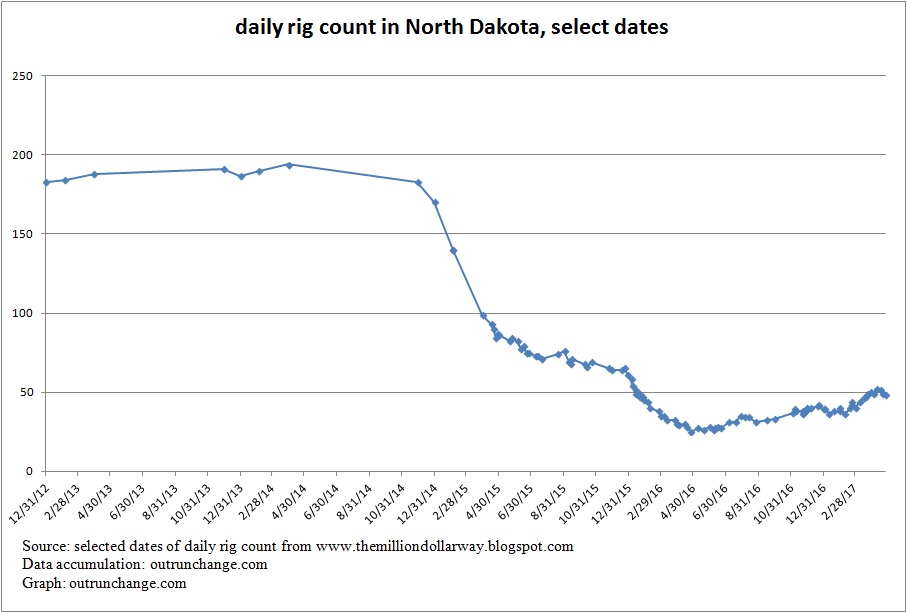
Decided to put all that data into a graph to help me see the trends from another direction. So, I combined all the data that has been accumulated haphazardly over time and put it in a graph.
If it helps you see some patterns, I’ll share my graph.
Keep a few things in mind:
- The data is accumulated when I think of jotting it down, so this is not a complete database
- Don’t read anything in to the gaps in data
- Data hasn’t been double-checked, so there are likely inaccuracies
- This shows general trends
- The efficiency of drilling and total output from a well has improved radically in the last few years so data is not comparable over long terms
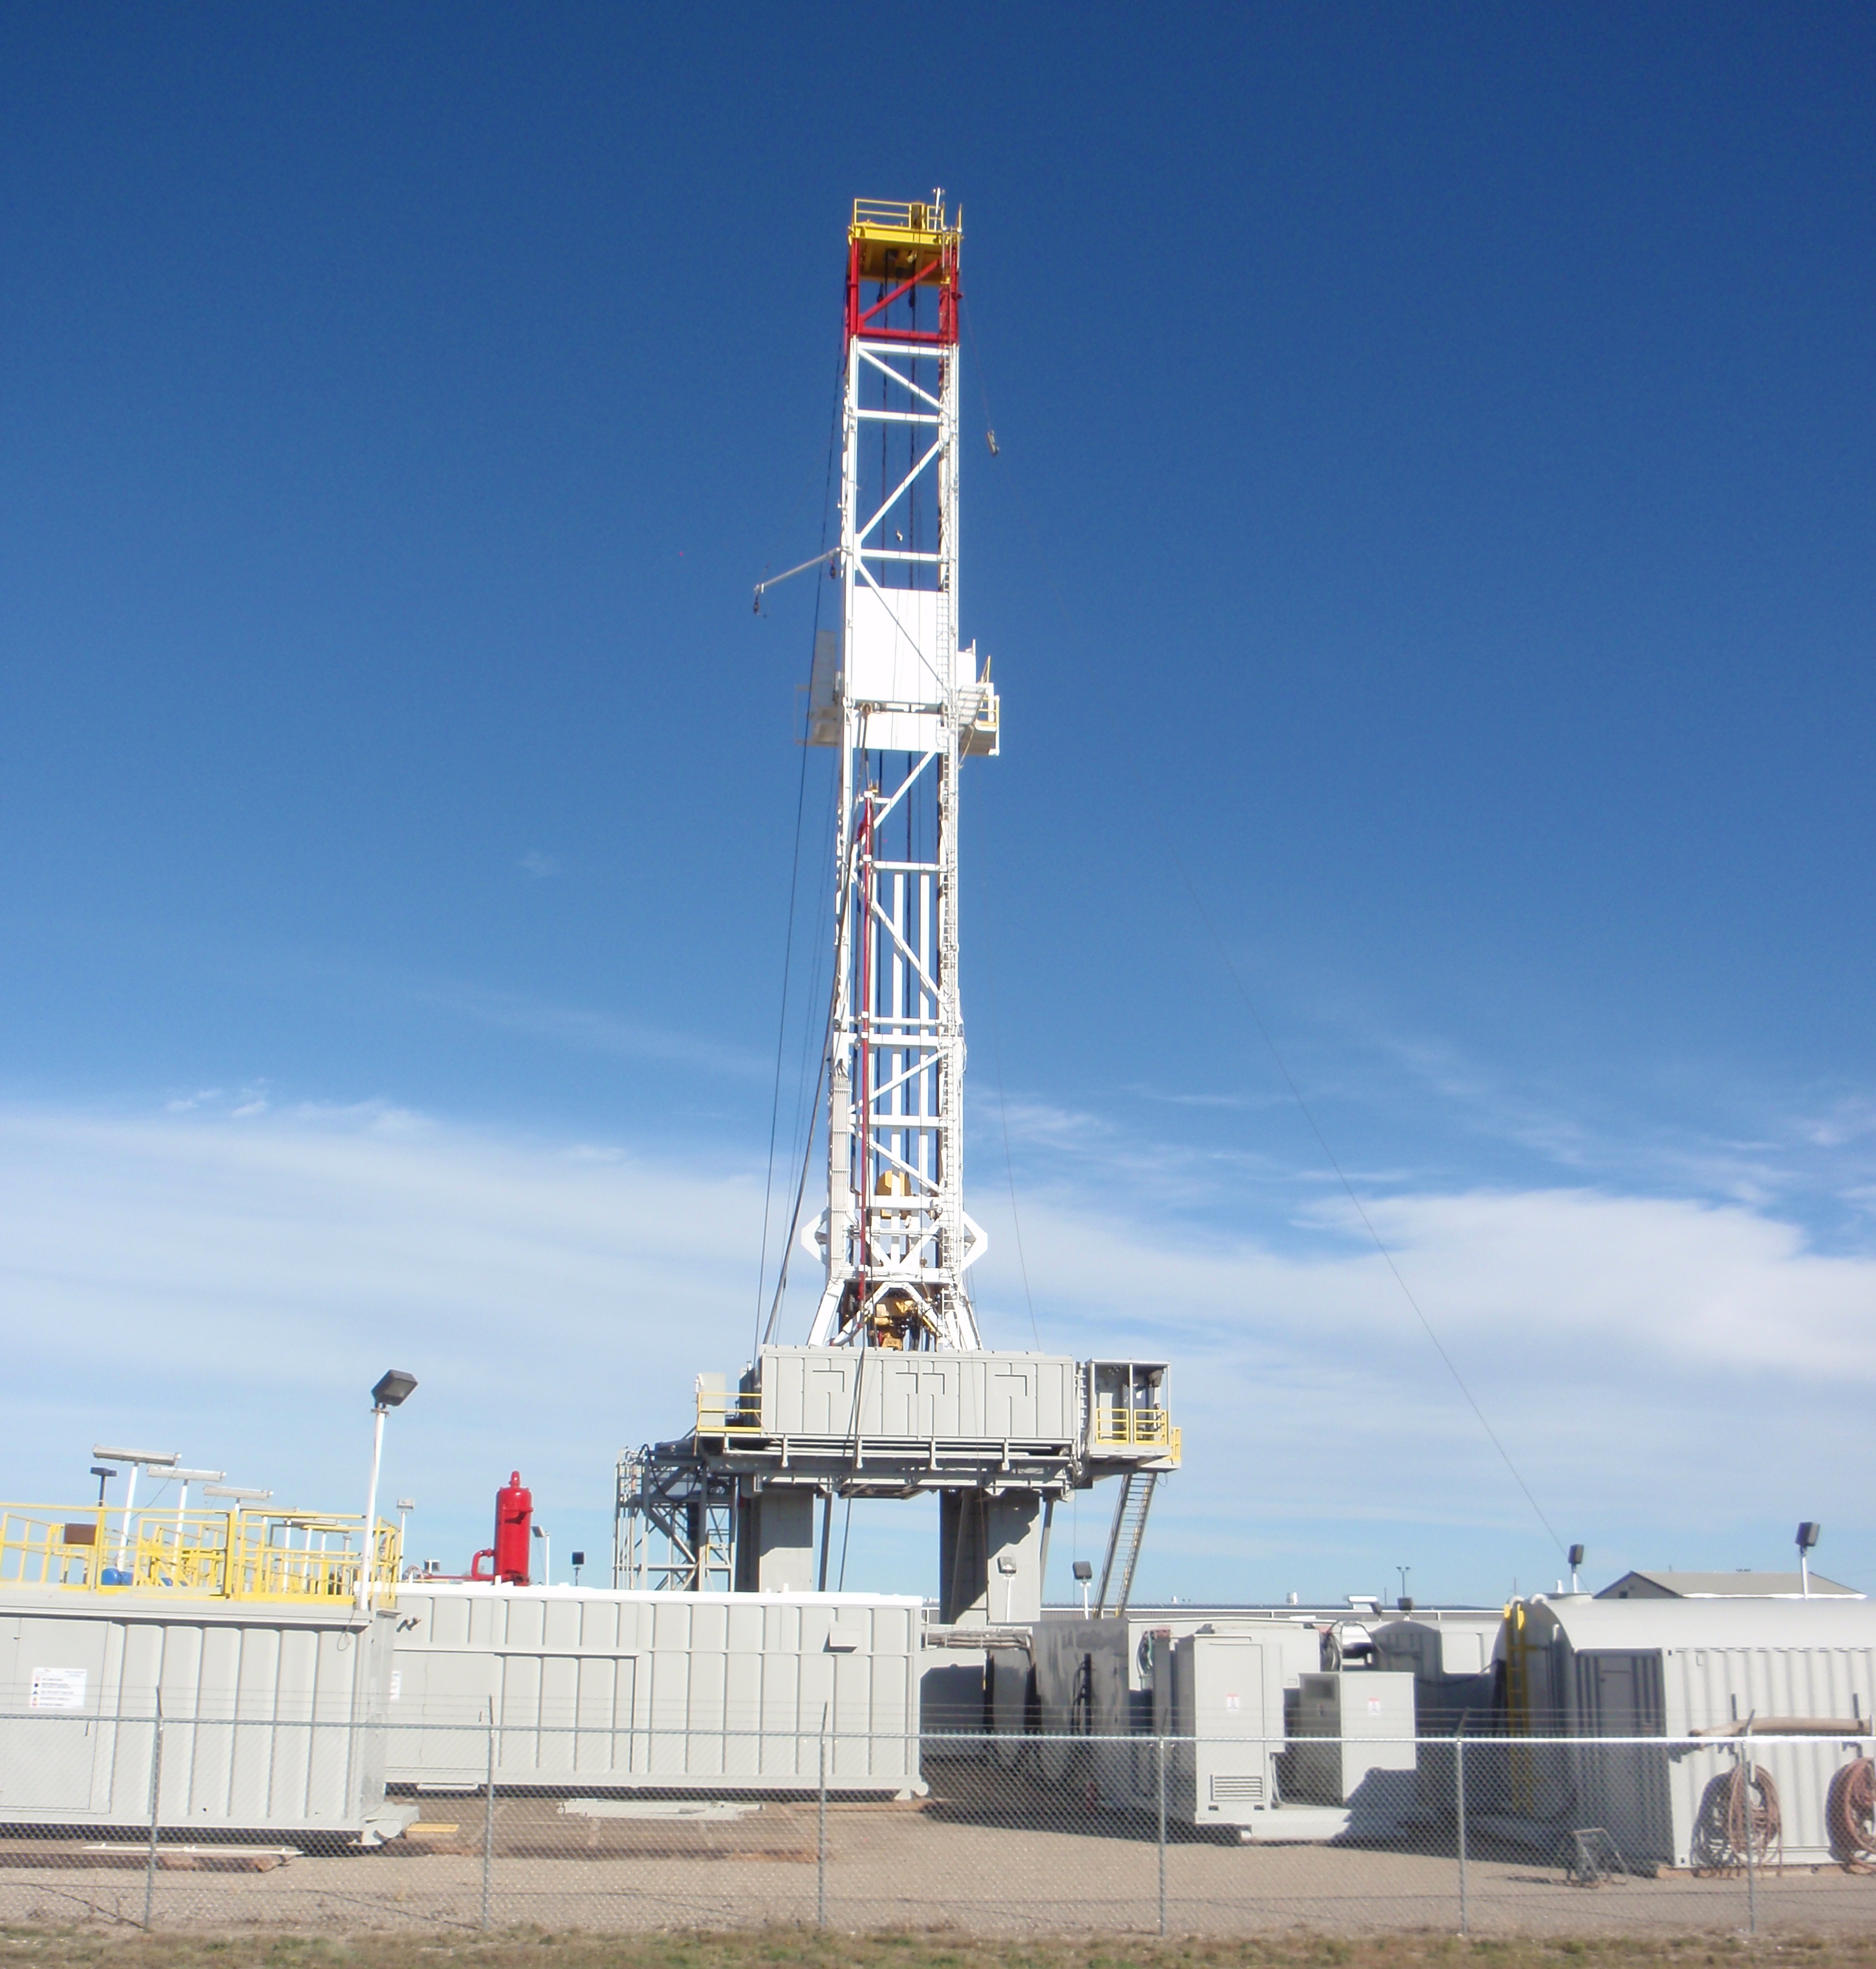
Having undercut my data and graph, here is a picture of the rig count in the state:
My raw data is listed below, along with my editorial comments along the way. Thought about dropping the narratives, but since old posts still have the comments, decided to keep them in.

Any data which was not pulled from MDW is so noted.
- 183 – 12/31/12
- 184 – 2/4/13
- 188 – 3/31/13
- 191 – 11/29/13
- 187 – 12/31/13
- 190 – 2/4/14
- 194 – 3/31/14
- 183 – 11/29/14
- 140 – 2/4/15
- 170 – 12/31/14
- 140 – 2/4/15
- 99 – 3/31/15
- 93 – 4/17/15
- 90 – 4/21
- 84 – 4/25
- 87 – 4/29
- 86 – 5/1
- 82 – 5/22
- 84 – 5/26
- 82 – 6/5
- 77 – 6/11- breaking through the 80 level
- 79 – 6/17
- 75 – 6/22
- 75 – 6/26
- 73 – 7/9
- 73 – 7/13
- 71 – 7/20
- 74 – 8/20
- 76 – 9/1
- 69 – 9/10 – rig count shows a sharp drop
- 68 – 9/14 – maybe a low?
- 71 – 9/15 – maybe bouncing?
- 68 – 10/9
- 66 – 10/14 – nope, not bouncing
- 69 – 10/22 – sort of looks like a new ‘trading range’, huh?
- 65 – 11/23
- 64 – 11/29/15
- 64 – 12/18
- 65 – 12/23
- 61 – 12/30/15
- 58 – 1/5/16 – rig count breaches into the 50s
- 54 – 1/7
- 51 – 1/13
- 49 – 1/14 – Wow, that was a fast trip through the 50s
- 49 – 1/20, per speech given by Mr. Helms
- 47 – 1/21
- 47 – 1/27
- 45 – 1/29
- 44 – 2/4/16
- 40 – 2/9
- 38 – 2/25
- 35 – 3/1
- 35 – 3/5
- 32 – 3/11
- 32 – 3/26 – has been at 32 for 2 weeks except for one day at 31
- 30 – 3/31/16
- 29 – 4/3
- 30 – 4/14
- 28 – 4/19
- 25 – 4/26
- 27 – 5/9
- 26 – 5/20
- 28 – 5/31
- 26 – 6/8
- 27 – 6/9
- 28 – 6/15
- 27 – 6/22/16
- 31 – 7/6
- 31 – 7-20
- 35 – 7/28
- 34 – 8/5
- 34 – 8/12
- 31 – 8/26
- 32 – 9/16
- 33 – 9/30
- 37 – 11/4
- 39 – 11/8
- 38 – 11/10
- 38 – 11/22 – during my visit to Williston, from Williston Herald
- 36 – 11/23 – again from the Herald
- 37 – 11/25 – end of my visit to Williston
- 40 – 11/29 – baseline from day before OPEC agreement
- 39 – 11/30 – day of OPEC agreement
- 39 – 12/1
- 40 – 12/8
- 41 – 12/21
- 42 – 12/22 – not a huge change, but definitely an upward trend
- 39 – 12/31/16
- 39 – 1/3/17
- 36 – 1/11 – looks like a drop, back to the levels of the summer and fall
- 38 – 1/20
- 38 – 1/30
- 40 – 1/31
- 36 – 2/9
- 40 – 2/19
- 42 – 2/22
- 44 – 2/23
- 40 – 3/1
- 44 – 3/10
- 46 – 3/16
- 47 – 3/20
- 48 – 3/23
- 49 – 3/24
- 50 – 3/31 – breach the 50 mark on the rising trend
- 49 – 4/4/17 – into 40s since mid-February
- 52 – 4/11/17
- 51 – 4/18/17 – tiptoed into the 50s for over a week
- 49 – 4/21/17
- 48 – 4/27/17