Previous post showed a graph of the new records of oil production in North Dakota in recent months.
Let’s look at the drilling and completion work driving the rising levels of production.
Keep in mind that the drastic improvements in productivity has decoupled the number of drilling rigs from the number of wells drilled.
Also keep in mind the ‘fracklog’, or the number of wells in the backlog of wells that have been drilled but not yet completed. In essence, wells are drilled and then left in inventory. When the expectations of prices are right and there are completion crews available, production companies can quickly complete a well and get it into production.
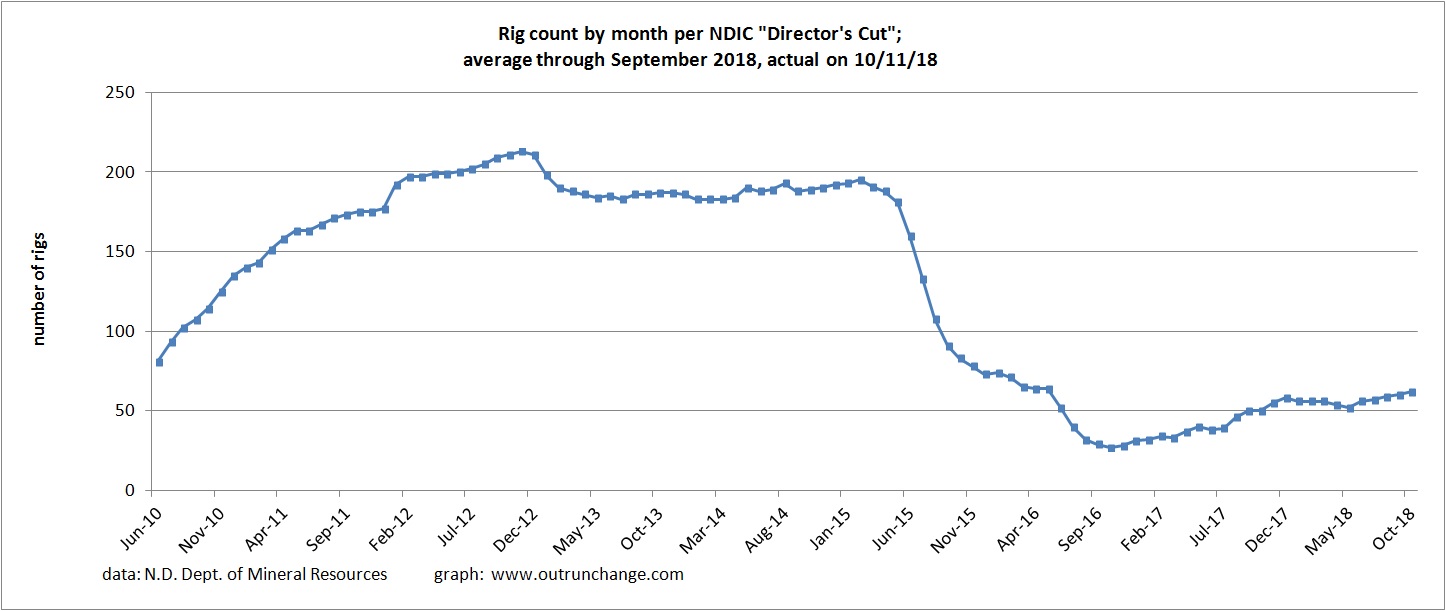
The number of drilling rigs in the field dropped dramatically during 2015. Since the fall of 2016, the count has slowly risen, with a noticeable pickup in the last five months:
The number of wells awaiting completion, the ‘fracklog’, has been increasing slightly over the last year but dropped over the last two months:

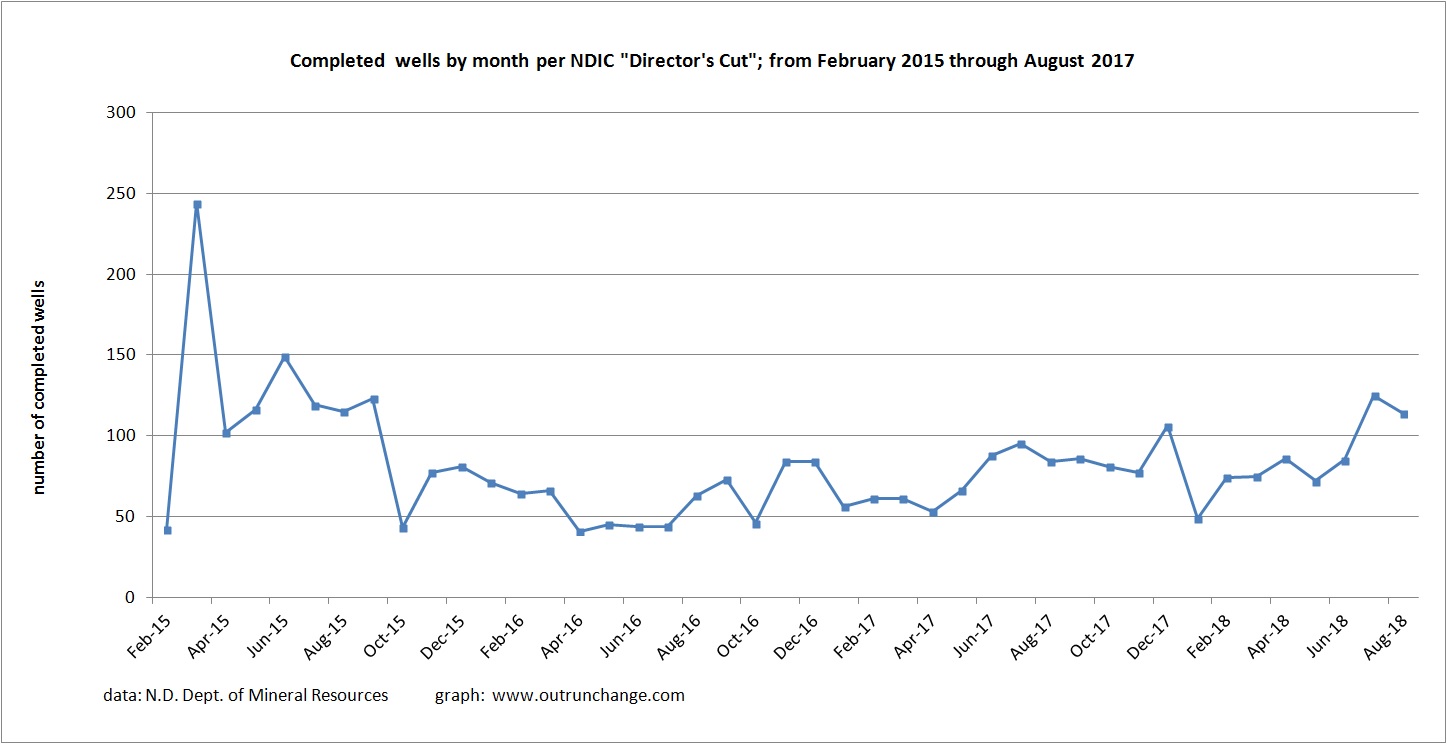
The number of wells completed has increased noticeably in the last two months. Completions from summer 2017 through summer 2018 are visibly higher than during 2016:
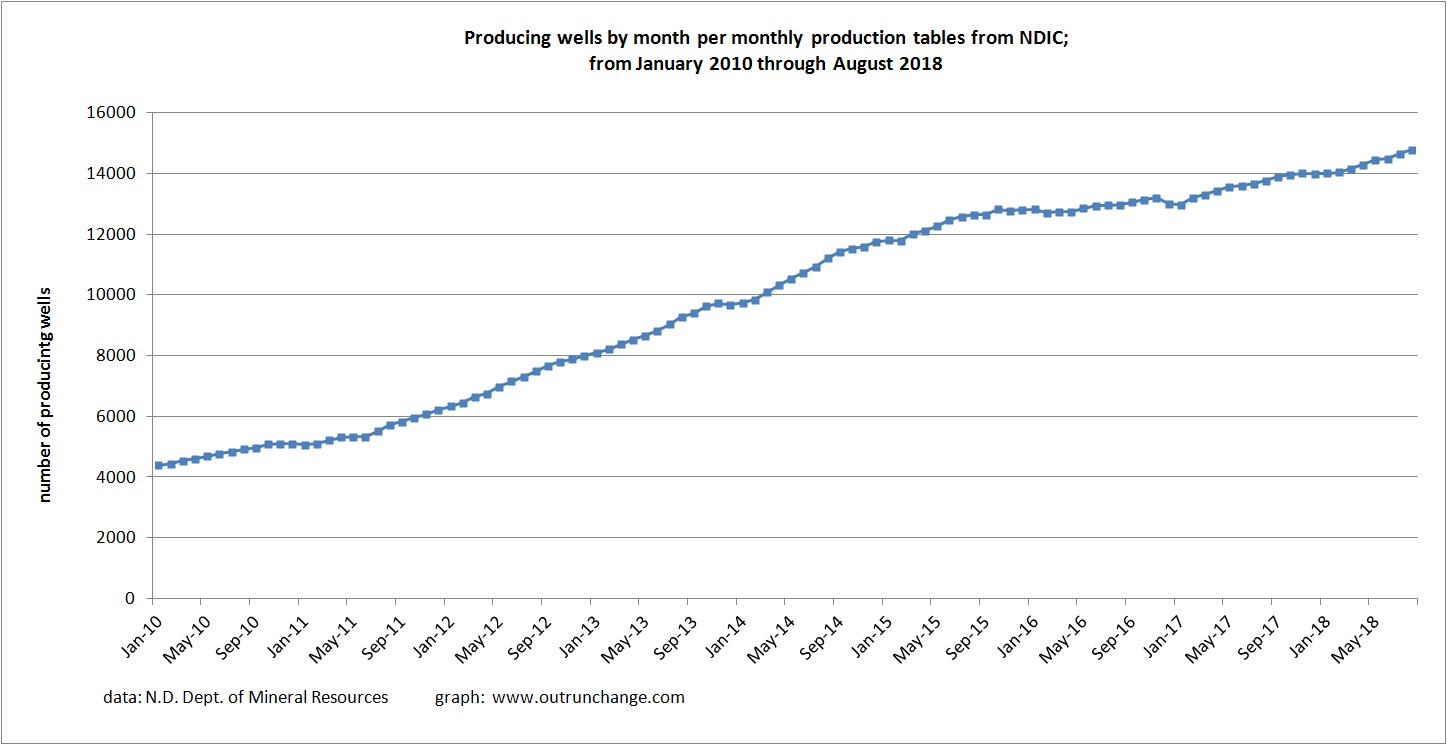
As a result of all that hard work, the number of producing wells has been steadily increasing since, oh, all the way back in 2010. Wells in production flattened during 2016 but has resumed its increase.