Release of the December production data in North Dakota lets us look at production for the full year. Following graphs show the average daily production and total for the year. Multiplying the monthly data by the sweet crude price in North Dakota reported in the Director’s Cut lets us see the value of production by month and total value for the year.
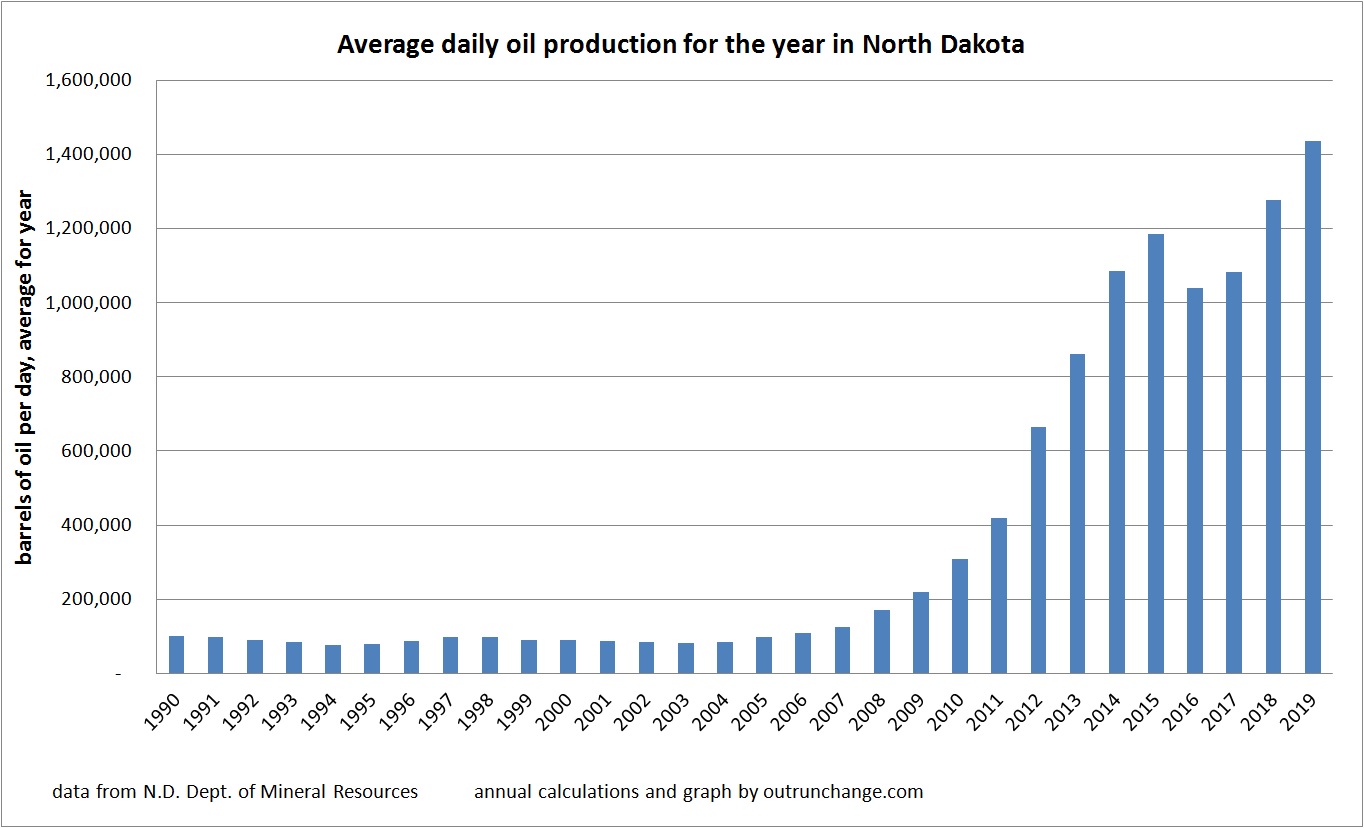
Calculation of the average daily oil production for the year shows a rise in 2019 to 1,436,675 bopd. That is a 158,987 bopd increase over 1,277,688 average bopd for all of 2018. The average production in 2015 was 1,184,009, before the Saudi price cut took full bite out of production.
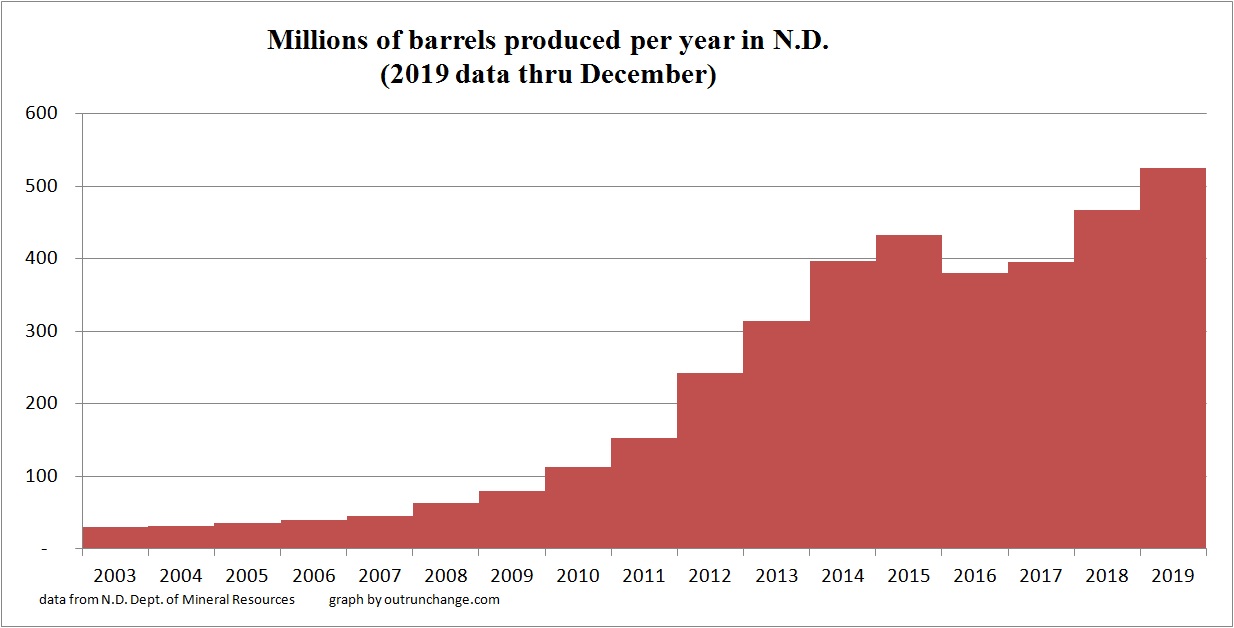
Total production for the year was 524.4 million barrels, which is a 58.0 million barrel increase over 2018’s record of 466.4 million barrels. For contrast, the annual production was running in the range of 27.7M barrels up to 45.1M in the 1991 through 2007 time frame.
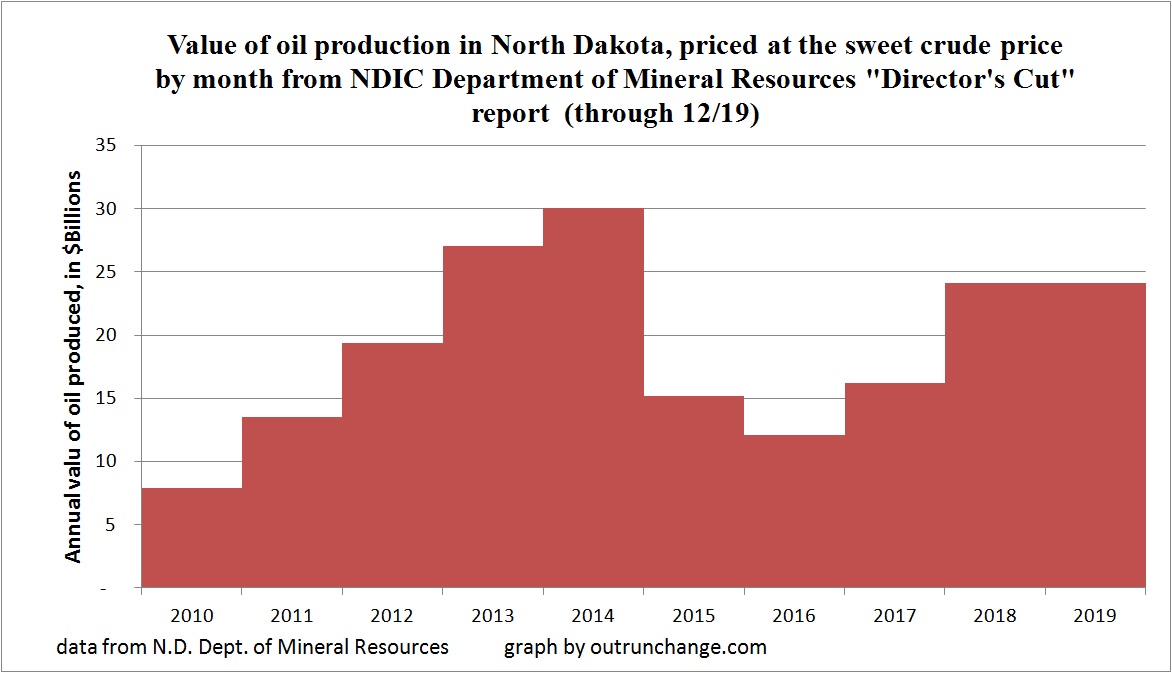
What is the value of the monthly production?
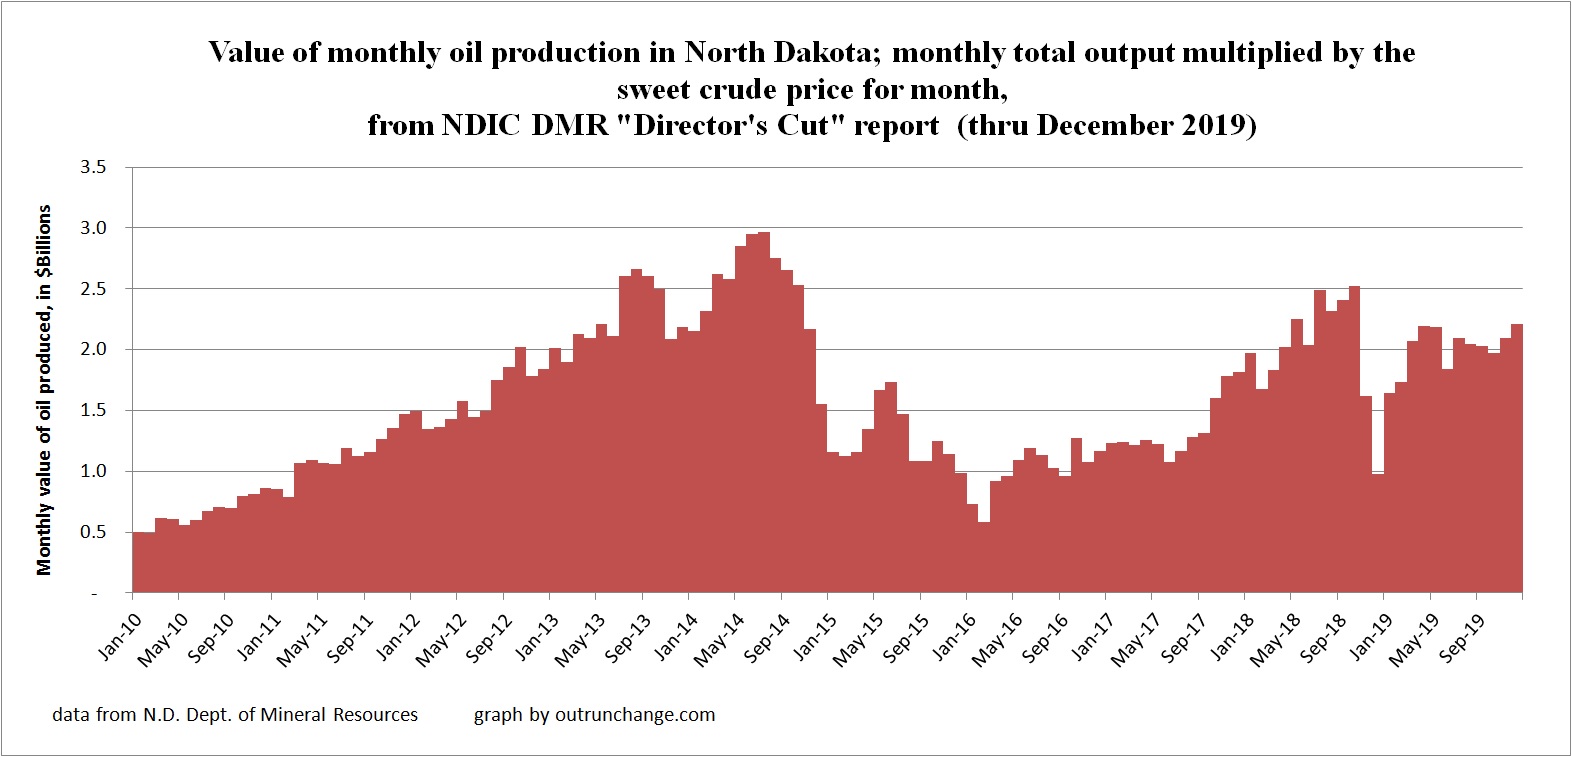
Aggregating that by year shows constant increase through 2014 with a sharp drop off in 2015. Since 2016, value of oil has increased with surprisingly stable total value in 2019 compared to 2018.