
Came across a superb resource during my research on nuclear armaments: Physics and Nuclear Arms Today (Readings from Physics Today)
(Update 4/2/20: Title of post revised.)
The book has articles from the early 1980s through 1991. Lots of good stuff. I bought the book especially for one article from 1983 dealing with US and Soviet nuclear forces. The gold mine in that article was a detailed inventory of strategic weaponry as of 1990. It gives a detailed listing of U.S. and Soviet land, submarine, and air based strategic weapons, including count, yield, equivalent megaton, and circular error probable (CEP). Lots of info I’ve been looking for a long time.
Information in that table is credited to The Military Balance 1989-90. At a price of over $200 for the paperback, don’t think I’ll be buying my own copy.
This post will give info on US weapons. Next post will describe the Soviet inventory. Third post will make some comparisons. Width limits on web pages mean there will be multiple tables.
A few notes on the columns. Yields are listed in megatons. CEP is circular error probable, or the average accuracy of a weapon. CEP is the distance at which 50% of the weapons would hit closer and 50% would hit further away.
A one megaton weapon is not ten times more powerful than a 100 kiloton weapon. To compare the destructive power a factor called equivalent megaton is used. The article and table explained this, which is brand new information to me. The equivalent megaton (EMT) is calculated using a formula: yield in megatons raised to the two-thirds power, or y^(2/3).
For example, a 200 kt ACLM has .34 EMT. A 335 kt Minuteman III has .48 EMT. The MMIII has rated power 67% higher but is actually only 41% more powerful.
This is the inventory by system and power of different US weapons. The number of launchers is listed along with yield and equivalent megaton. One launcher is an ICBM silo, SLBM tube, or bomber. The total MT and EMT is then calculated.
UPDATE 4/2/20: I realized last night there was a major error in the following table. I added the weapon yield and the number of warheads instead of multiplying them. Table has been corrected. Instead of the preferred method of striking out the error and italicizing the correction, I replaced the table.
| launcher | yield | equiv mt | total mt | total Equiv mt | |
| Minuteman II | 450 | 1.200 | 1.13 | 540 | 508 |
| Minuteman III Mk12 | 200 | 0.170 | 0.31 | 102 | 184 |
| Minuteman III Mk12A | 300 | 0.335 | 0.48 | 302 | 434 |
| Peacekeeper | 50 | 0.350 | 0.50 | 175 | 248 |
| —- | —- | —- | |||
| total land based | 1,000 | 1,119 | 1,375 | ||
| x | |||||
| Poseidon C-3 | 224 | 0.040 | 0.12 | 90 | 262 |
| Trident D-4 | 384 | 0.100 | 0.22 | 307 | 662 |
| SLCM | 300 | 0.200 | 0.34 | 60 | 103 |
| —- | —- | —- | |||
| total sea based | 908 | 457 | 1,026 | ||
| x | |||||
| B52G int. bomb or SRAM | 69 | 1.000 | 1.00 | 828 | 828 |
| B52G int. bomb or SRAM | 98 | 1.000 | 1.00 | 1,176 | 1,176 |
| external ALCM | above | 0.200 | 0.34 | 235 | 402 |
| B-52H int. bomb or SRAM | 99 | 1.000 | 1.00 | 1,188 | 1,188 |
| external ALCM | above | 0.200 | 0.34 | 238 | 406 |
| B-1B int.& ext. all SRAM | 97 | 1.000 | 1.00 | 3,686 | 3,686 |
| or int. & ext. all ALCM | alternate | 0.200 | 0.34 | 737 | 1,261 |
| reverse above options | (97) | (1.20) | (1.3) | (4,423) | (4,947) |
| B1-B, assume 1/2 load SRAM | 97 | 1.000 | 1.00 | 1,843 | 1,843 |
| assume 1/2 load of ALCN | above | 0.200 | 0.34 | 369 | 630 |
| —- | —- | —- | |||
| total bomber based | 363 | 5,876 | 6,474 | ||
| —- | —- | —- | |||
| total of above | 2,271 | 7,452 | 8,875 |
UPDATE 4/1/20: I just realized there is a major error in the above table; please disregard. Update 4/2/20: Error has been corrected.
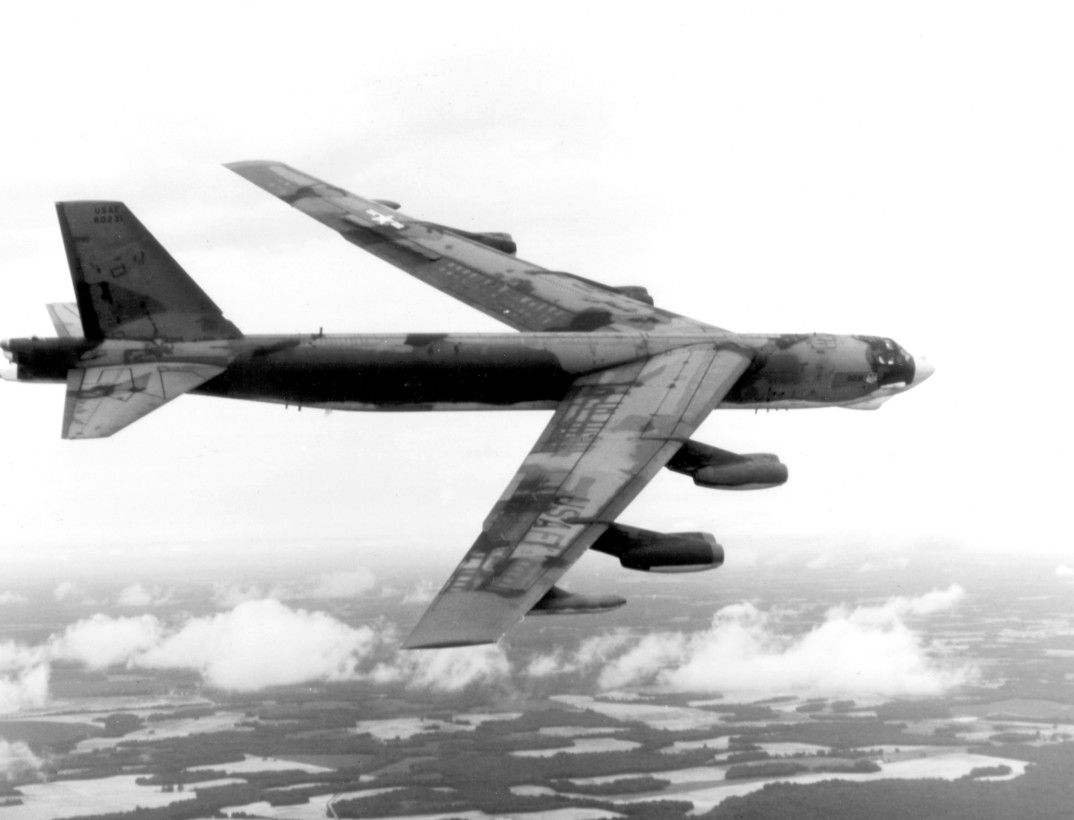
A B-52G Stratofortress banks to the right near Seymour Johnson AFB, N.C., during Global Shield 79. Photo courtesy of U.S. Air Force.
For those weapon systems, here is the number of launchers, warheads per launcher, and total warheads for the weapon class. The CEP in meters is listed. Then the probability of destroying a missile silo hardened to 2,000 pounds per square inch. The options there are no, yes, 4 m (site would not only be destroyed but also under at least 4 meters of dirt), and range (PSI would be high enough but range wouldn’t allow reaching into the missile fields).
| launcher | warhead | total warhead | CEP (m) | 2000 psi | |
| Minuteman II | 450 | 1 | 450 | 370 | 4 m |
| Minuteman III Mk12 | 200 | 3 | 600 | 220 | 4 m |
| Minuteman III Mk12A | 300 | 3 | 900 | 220 | 4 m |
| Peacekeeper | 50 | 10 | 500 | 100 | 4 m |
| —- | —- | ||||
| total land based | 1,000 | 2,450 | |||
| . | |||||
| Poseidon C-3 | 224 | 10 | 2,240 | 450 | no |
| Trident D-4 | 384 | 8 | 3,072 | 450 | no |
| SLCM | 300 | 1 | 300 | 75 | range |
| —- | —- | ||||
| total sea based | 908 | 5,612 | |||
| . | |||||
| B52G int. bomb or SRAM | 69 | 12 | 828 | ||
| B52G int. bomb or SRAM | 98 | 12 | 1,176 | ||
| external ALCM | above | 12 | 1,176 | ||
| B-52H int. bomb or SRAM | 99 | 12 | 1,188 | ||
| external ALCM | above | 12 | 1,188 | ||
| B-1B int.& ext. all SRAM | 97 | 38 | 3,686 | ||
| or int. & ext. all ALCM | alternate | 38 | 3,686 | ||
| reverse above options | (97) | (76) | (7,372) | ||
| B1-B, assume 1/2 load SRAM | 97 | 19 | 1,843 | ||
| assume 1/2 load of ALCN | above | 19 | 1,843 | ||
| —- | —- | ||||
| total bomber based | 363 | 9,242 | |||
| —- | —- | ||||
| total of above | 2,271 | 17,304 |
I made a long list of assumptions to derive the above tables.