There’s an idea that we don’t make anything in the U.S. anymore. Well, we do import a huge portion of the good stuff we enjoy everyday. Yet we still make a huge amount of stuff here.
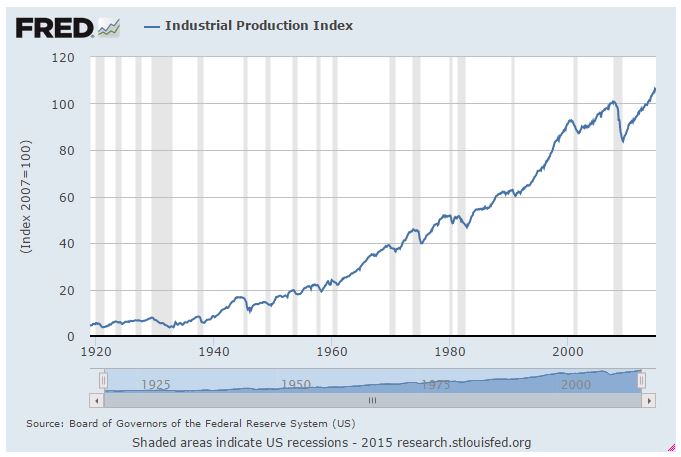
Check out this indicator of total industry production in the US. The peak production level is today:
This is from the St. Louis Federal Reserve, which has a humongous database called the Federal Reserve Economic Data, or FRED.
What does the index above cover? From the FRED site:
The Industrial Production Index (INDPRO) is an economic indicator that measures real output for all facilities located in the United States manufacturing, mining, and electric, and gas utilities (excluding those in U.S. territories).(1)
So industrial production in the U.S. is at a record level. Cool.
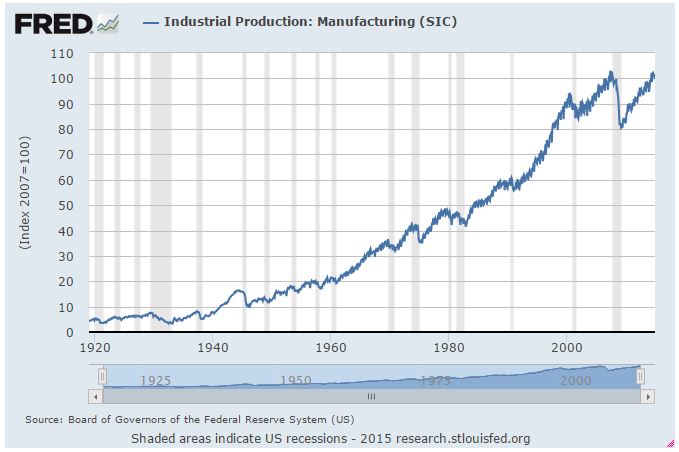
Want to check out manufacturing only? Okay, here is it:
September ’14 index was 102.18. Previous peak was June ’07 at 103.03. So that is not at the record level, but pretty close. Down in the last few months, but that’s fine.
How about energy?
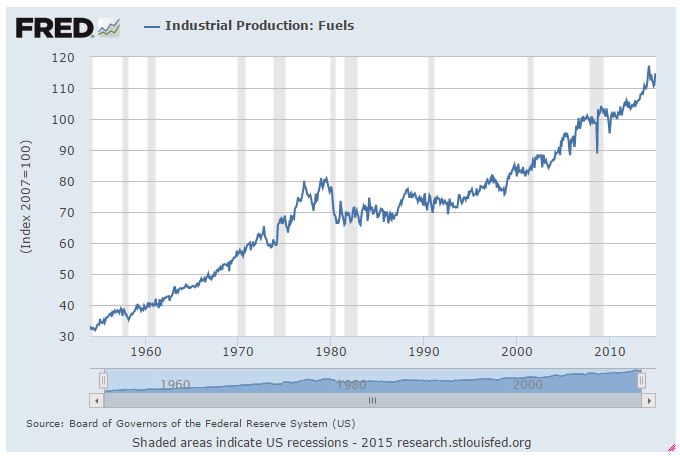
The Fuels index is here:
I don’t know what the Fed includes in energy for that index. The table doesn’t give an explanation. Doesn’t matter. It corresponds roughly to lots of graphs I’ve seen, all of which shows we are in a time of energy abundance.
Almost a straight line up since the late 80s. Hmm, what caused that?
What is behind that rapid increase since the Great Recession?
Wait one minute!
Straight lines? Going up? Not approaching zero?
That can’t be.
Prof Hubert and his still vibrant and vocal advocates say that oil would quickly and irreversibly drop and head for near-zero right after the mid 70s peak. Hmm. Must be my imagination that production has been higher every month since early ’99 than the maximum-never-to-be-seen-again level of ’77.
The inspiration for my graphing is Prof. Mark Perry at Carpe Diem.
My new inspiration for poking around the FRED data is Prof. Don Boudreaux at Cafe Hayek.
Thanks profs!


