Back (reverse) of 2019 currency issued in Venezuelan.

Previous post showed the obverse of the bills issued in June 2019. That post also discussed the hyperinflation that made it necessary to add a couple of zeros to the bills. Unfortunately by the time the largest bill was issued it was only worth less than one US dollar.

Here are the reverses (back) of the bills issued in June 2019:

10,000 Bs. S, equal to 1,000,000,000 Bs. F., yes one billion

Mausoleo del Libertador Simon Bolivar – Mausoleum of liberator Simon Bolivar

20,000 Bs. S, equal to 2,000,000,000 Bs. F.

Continue reading “Back (reverse) of 2019 currency issued in Venezuelan.”

Back (reverse) of Venezuelan currency issued in 2018.

Previous post illustrated the obverse (front) of the 2018 issue currency of Venezuela.

For your visual enjoyment, here is the reverse of these beautiful bills:

2 Bs. S., equal to 200,000 Bs. F.

(sorry, can’t quite read name of the bird)

5 Bs. S., equal to 500,000 Bs. F.

Sapito Rayado – striped sapitao

Continue reading “Back (reverse) of Venezuelan currency issued in 2018.”

Front (obverse) of 2019 currency issued in Venezuelan.

Ongoing hyperinflation in Venezuela was so severe after the conversion to Bolivar soberano (Bs.S) in August 2018 that far higher denomination currency had to be introduced in June 2019.

To illustrate the concept, the exchange rate at the end of July 2018 was 3,600,000 Bs. F. to $1. That would be equivalent to 36 Bs. S. to $1 using the new currency.

At the end of August 2018 the exchange rate was 90 Bs.S to $1. From 36 to 90 in a month.

At the end of December 2018, the exchange rate was 730 Bs. S to $1.00. That meant that the highest denomination note in circulation, the 500 Bs.S. was worth less than one US dollar. By the way it had been worth it $8.47 at the end of August 2018, just four months earlier.

By the time the new denominations were in circulation at the end of June 2019 the exchange rate was 7,880 Bs. S to $1. 

Oh, that 500 Bs. S. issued back in August 2018? It was worth $0.06 at the end of June 2019.

That one bill dropped from being worth US$8.47 in August 2018 all the way down to US$0.06 in June 2019.

The obverse (front) of the bills issued in June 2019:

10,000 Bs. S, equal to 1,000,000,000 Bs. F., yes one billion

Simon Bolivar

Continue reading “Front (obverse) of 2019 currency issued in Venezuelan.”

Front (obverse) of Venezuelan currency issued in 2018.

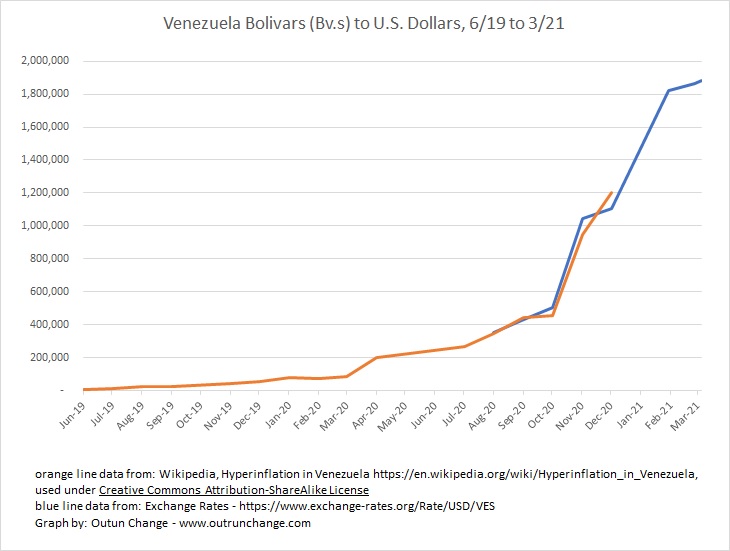
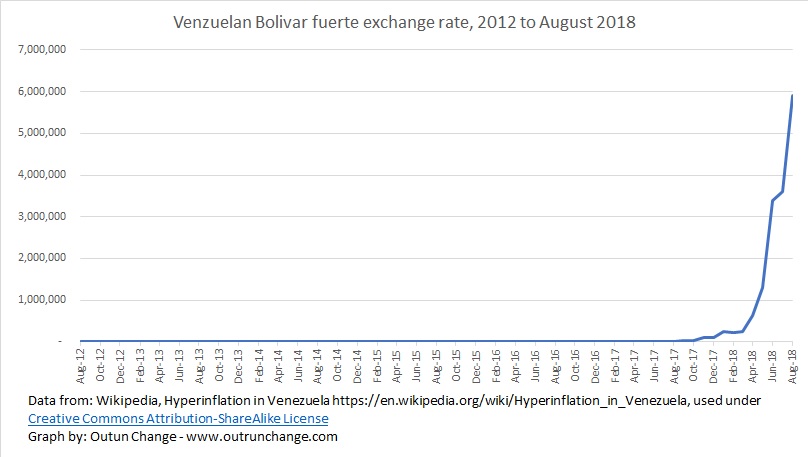
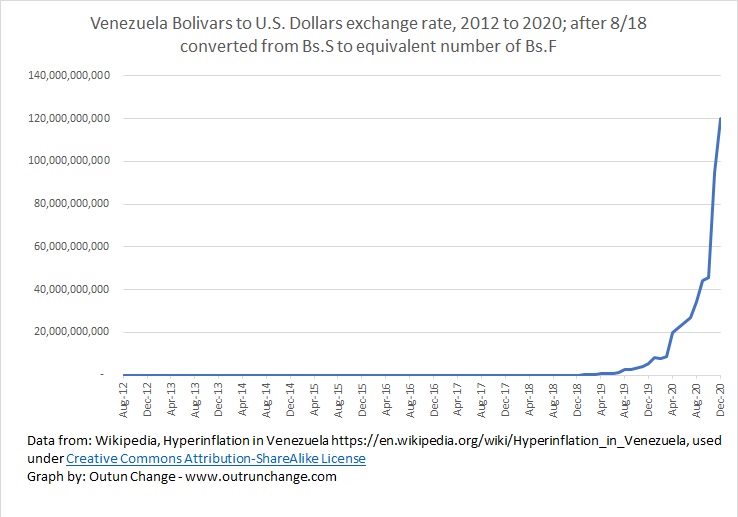
Inflation was so severe in Venezuela during the 2017 and 2018 timeframe that currency in circulation was worthless. In 2018 the government replaced the previous currency, called the Bolivar fuerte (Bs.F) with a new currency, called the Bolivar soberano (Bs. S). 

The exchange rate was 100,000 of the old Bs. F. for 1 of the new Bs. S. . Essentially that lopped five digits off currency and prices.

To illustrate the concept, the highest denominated old currency was 100,000 Bs. F. The lowest denominated new currency was 2 Bs. S., which is the equivalent to 200,000 Bs. F.

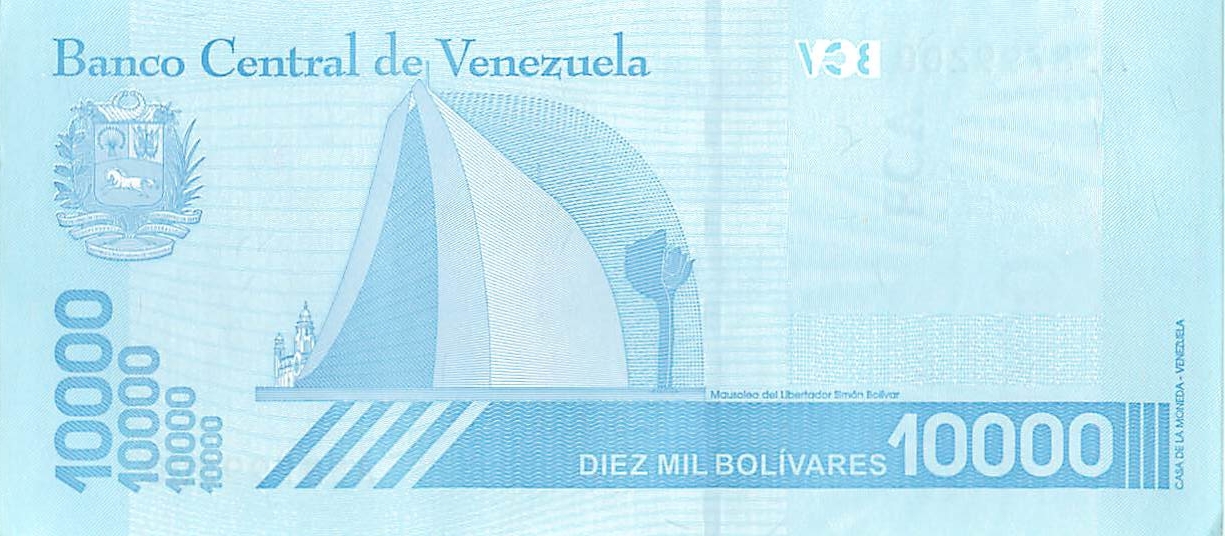
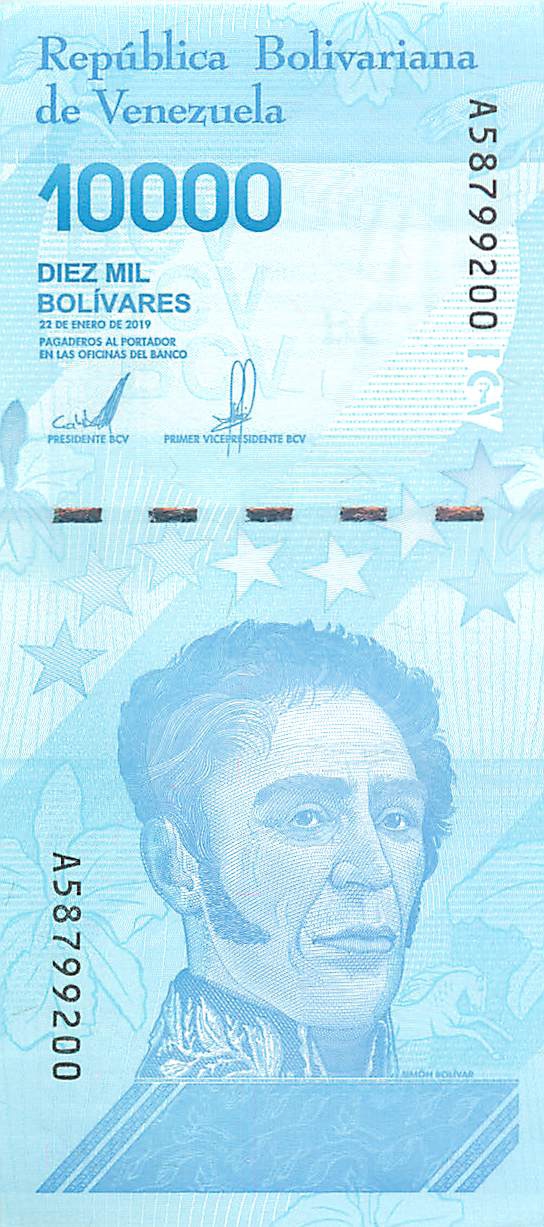
In 2019 the government issued three extremely high denomination notes. More on that in future posts.

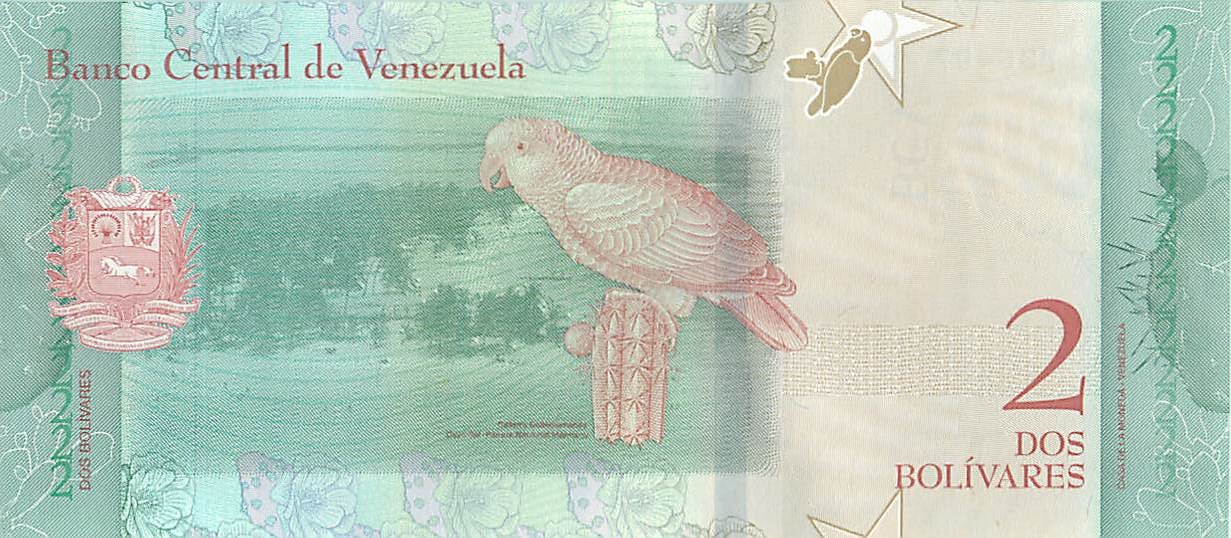
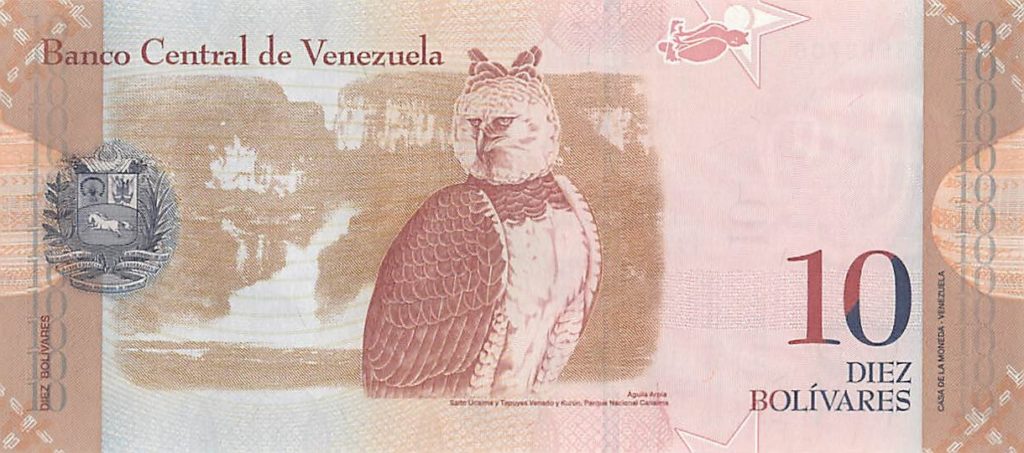
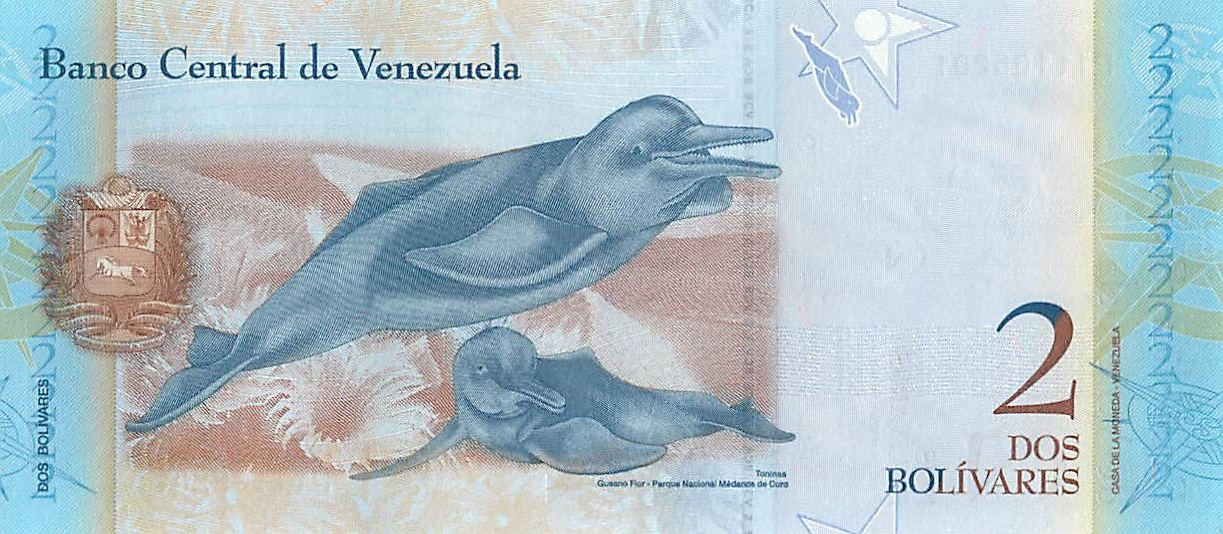
This post and the next will illustrate the 2018 currency. As you would expect it is beautiful. Full-color, with nice portrait on the obverse, fun illustration of animals on the reverse, a metal security band, and a large watermark.

The currency is a delight to view. Each obverse and reverse is a lovely work of art. I’m being serious. The generous doses of sarcasm heaped on socialism will follow later. For the moment let’s enjoy the visually pleasing currency.

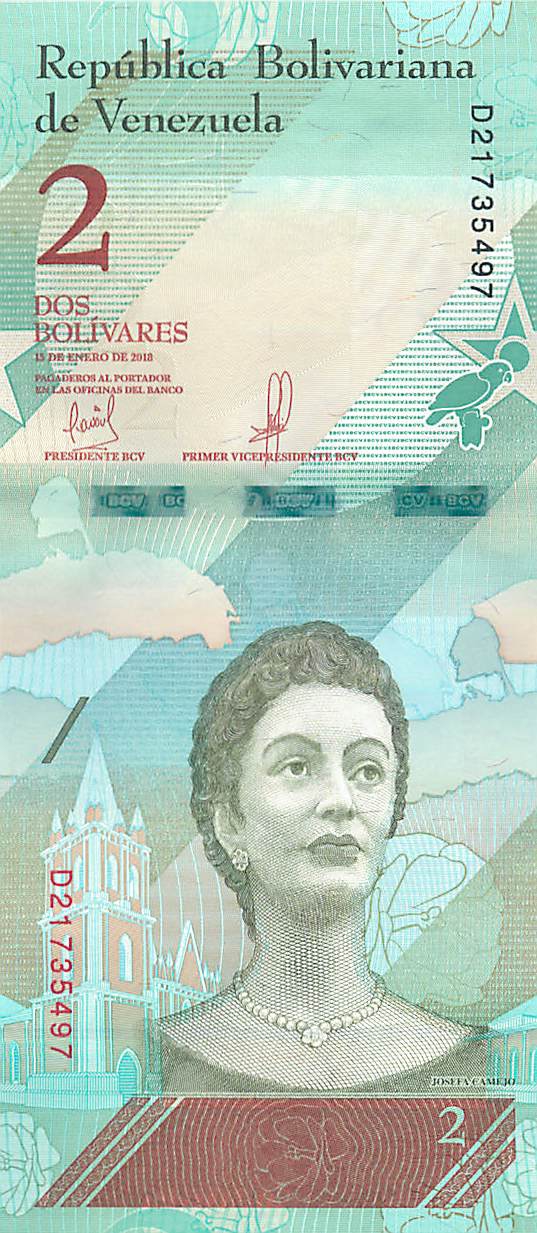
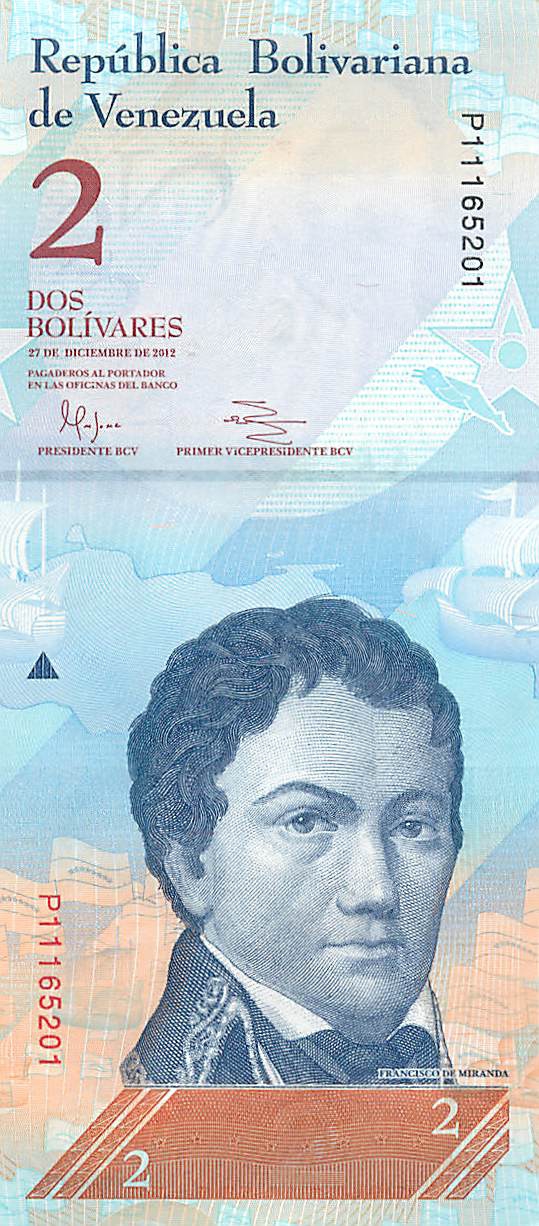
The obverse, or front, of the 2018 series:

2 Bs. S., equal to 200,000 Bs. F.

Josefa Camejo

5 Bs. S., equal to 500,000 Bs. F.

José Felix Ribas

Continue reading “Front (obverse) of Venezuelan currency issued in 2018.”

Illustration of Venezuelan hyperinflation from 2012 through 2018. Part 5.

Let’s take a look at what hyperinflation does to the value of currency.

Using the Bolivares Fuertes (Bv.f) currency, we can construct a visualization of hyperinflation.

Previous posts describe the horrid inflation suffered by the people in Venezuela:

Imagine a small basket of a few items that would cost $1. The following illustrations are how many Bolivares fuerte it would take to buy that little basket.

From 2010 and earlier up until August 2012, 10 Bv.f could convert to US $1. That was before the inflation took off.

Value to US$1 in 8/12 and earlier:

This image has an empty alt attribute; its file name is 10-bolivares-reverse-1024x453.jpg

What happened in the next six months?

Continue reading “Illustration of Venezuelan hyperinflation from 2012 through 2018. Part 5.”

Back (reverse) of Venezuelan currency, 2007 – 2017

Reverse of 100,000 Bolivares paper currency. In 8/12 this would have been worth $10,000. In 9/15, only $125. By 12/17, it was worth $0.90. In 12/18, seven of these would have been worth a US penny.

Before we use Venezuelan Bolivares currency to show the devastation of hyperinflation, let’s finish looking at the currency.

Previous post showed the front (obverse) of 2 through 100,000 Bolivares paper money.

Now let’s look at the back (reverse).

The reverse side shows various wildlife.

Look in the are that seems to be blank and you can see a hint of the watermark. Holding the bill up to light reveals a watermark of the face engraved on the obverse.

2 – dated 12/27/12 – Toninas

5 – dated 5/24/07, Cachicama gigante, giant cachicamo

Continue reading “Back (reverse) of Venezuelan currency, 2007 – 2017”

Front (obverse) of Venezuelan currency, 2007 – 2017

Reverse of 100,000 Bolivares paper currency. This is now worthless. In 12/20, one US dollar could get you 1.2 MILLION of these.

To illustrate the devastation from hyperinflation, we will now use Venezuelan Bolivares currency to see what that destruction looks like in terms of paper money.

To start, we will look at the currency itself.

As usual for currency outside the U.S., the paper money of Venezuela are esthetically beautiful. All the bills are colorful with lovely illustrations. All the ones we will now see have a nice sized watermark at the otherwise empty space. The watermarks are same face at the bottom of the obverse (front).

Portraits on the obverse of the currency are patriotic reminders of the struggle for Venezuelan independence.

To start our pictorial excursion, here are the obverses of the 2 Bolivar through 100,000 Bolivar currency:

2 – dated 12/27/12, featuring Francisco de Miranda, his efforts for independence in South America failed; he served as forerunner of Simon Bolivar.

5 – dated 5/24/07, featuring Negro Primero

Continue reading “Front (obverse) of Venezuelan currency, 2007 – 2017”

This is hyperinflation, Venezuela edition. Expected devastation from socialism. Part 4.

Final graph in this series of posts showing the devastating hyperinflation currently running loose in Venezuela will combine two sets of data.

Purpose of doing so is to see if the two sets of data overlap so that there is some good longer-term information that can be used into the future. The source for current data only goes back to late 2020.

Graph at the top of this post shows exchange rate of Venezuelan Bolivars into US dollars between June 2019 and March 2021. This graph is expressed in Bolivar soberanos (Bv.s).

Continue reading “This is hyperinflation, Venezuela edition. Expected devastation from socialism. Part 4.”

This is hyperinflation, Venezuela edition. Courtesy of socialism, of course. Part 3

Let’s look at the exchange rate in Venezuela in more detail, breaking out the exchange rate before and after 2018. On the previous graphs it looked like the exchange rate deterioration wasn’t that bad in the lead up to 2018 and it looks like things turned real bad starting in 2019.

That’s the weird thing about hyperinflation. If you remove the recent severe acceleration you still see the rapid increase earlier.

Graph at the top of this post shows exchange rate through 2018. It looks like hyperinflation kicked off in early 2018. Actually, it was going crazy before that. Inflation so severe as to destroy the economy has been running since 2012. Let’s change that graph above to a logarithmic scale to show the percentage changes better.

Continue reading “This is hyperinflation, Venezuela edition. Courtesy of socialism, of course. Part 3”

This is hyperinflation, Venezuela edition. Courtesy of socialism, as usual. Part 2.

Hyperinflation is running rampant in Venezuela. Previous post described the deteriorating exchange rate in 2020 and thus far in 2021.

Let’s take a longer-term view to see the devastation of hyperinflation over the course of several years. We will turn to data available from Wikipedia in the article Hyperinflation in Venezuela.

Continue reading “This is hyperinflation, Venezuela edition. Courtesy of socialism, as usual. Part 2.”

This is hyperinflation, Venezuela edition. Courtesy of socialism, as always. Part 1.

Banknotes of Zimbabwe after hyperinflation. Image courtesy of Adobe Stock.

Socialism in Venezuela has produced the expected results – poverty, a collapsing economy, and people fleeing for their lives. Twenty some odd years of socialism has also produced another foreseeable consequence – hyperinflation.

Let’s track the exchange rate of Venezuelan Bolivars to US dollar as an indicator.

According to Exchange-Rates.org, here is exchange rate of the Venezuelan bolivar to dollar from 9/11/20 through 3/5/21. Here is the month end data:

Continue reading “This is hyperinflation, Venezuela edition. Courtesy of socialism, as always. Part 1.”