Reposted from May 31, 2021. Following comments are still valid today.
…
Our freedom is under rapidly increasing assault by many politicians who think they are kings and queens appointed by divine right instead of having merely won a few more percentage points of the vote than their opponent in the last election. In the last year public health officials at the federal, state, and county levels who lack self-awareness of how often they beclown themselves have joined in the efforts to shred our liberty.
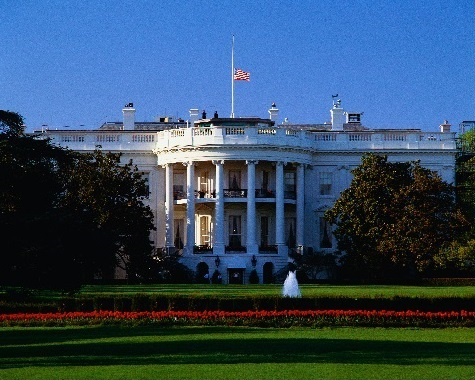
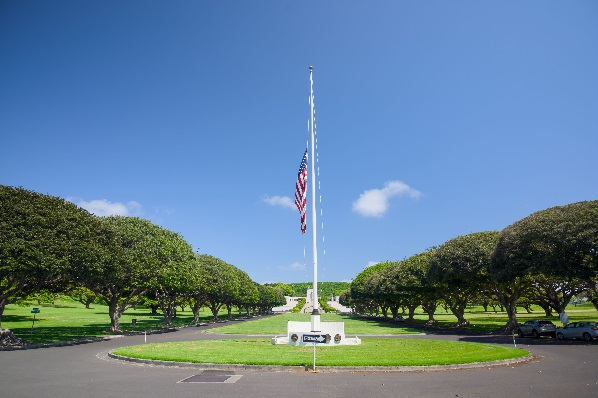
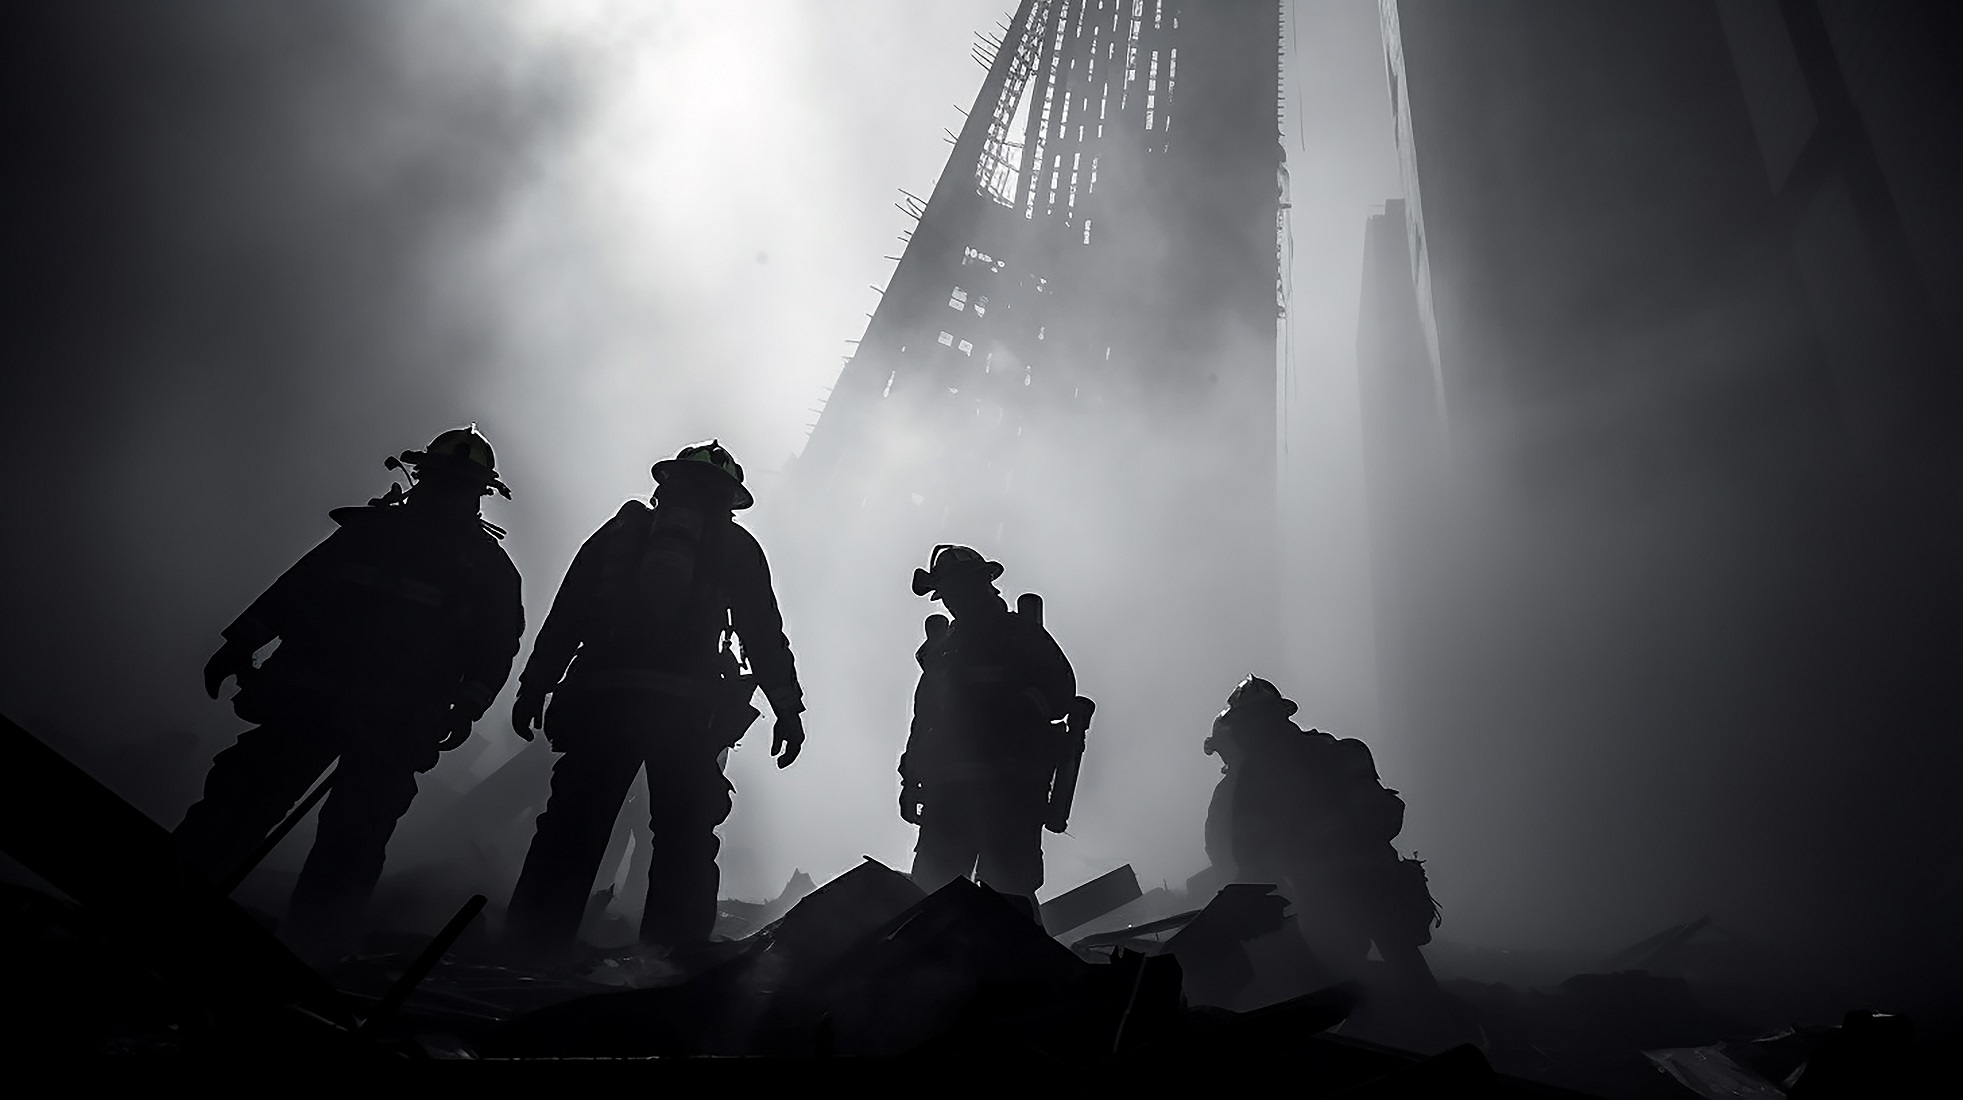
As a result of these attacks, it is ever more important that on this Memorial Day we remember those who shed all their blood so that we may be free.
A ‘thank you’ from me is so trivial, yet that is all I have.
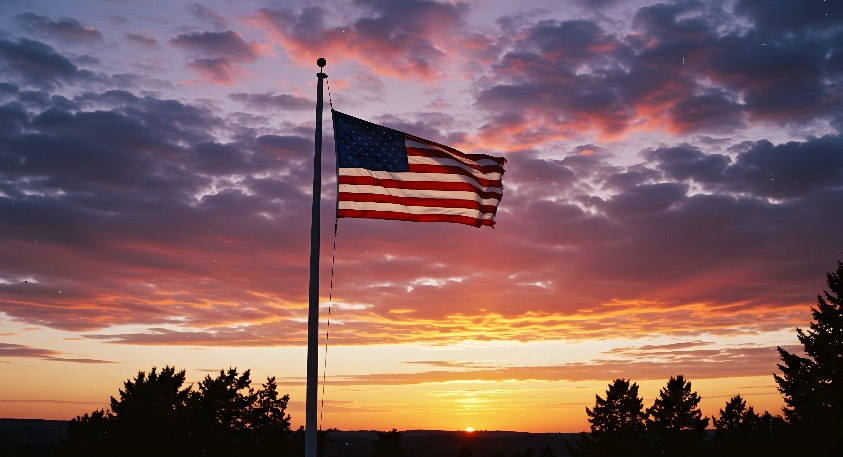
I will demonstrate my appreciation for freedom purchased by others by exercising freedom.
Yesterday I exercised my freedom of religion. Tomorrow I will exercise my economic freedom, also called pursuit of happiness, by running my business the way I choose.
I have posted variations of the following ideas several times before. I will continue to make these points routinely.
Continue reading “America is Land of the Free, Because of the Brave. My ‘thank you’ to those who made it so.”