Oil production in North Dakota for 2019.

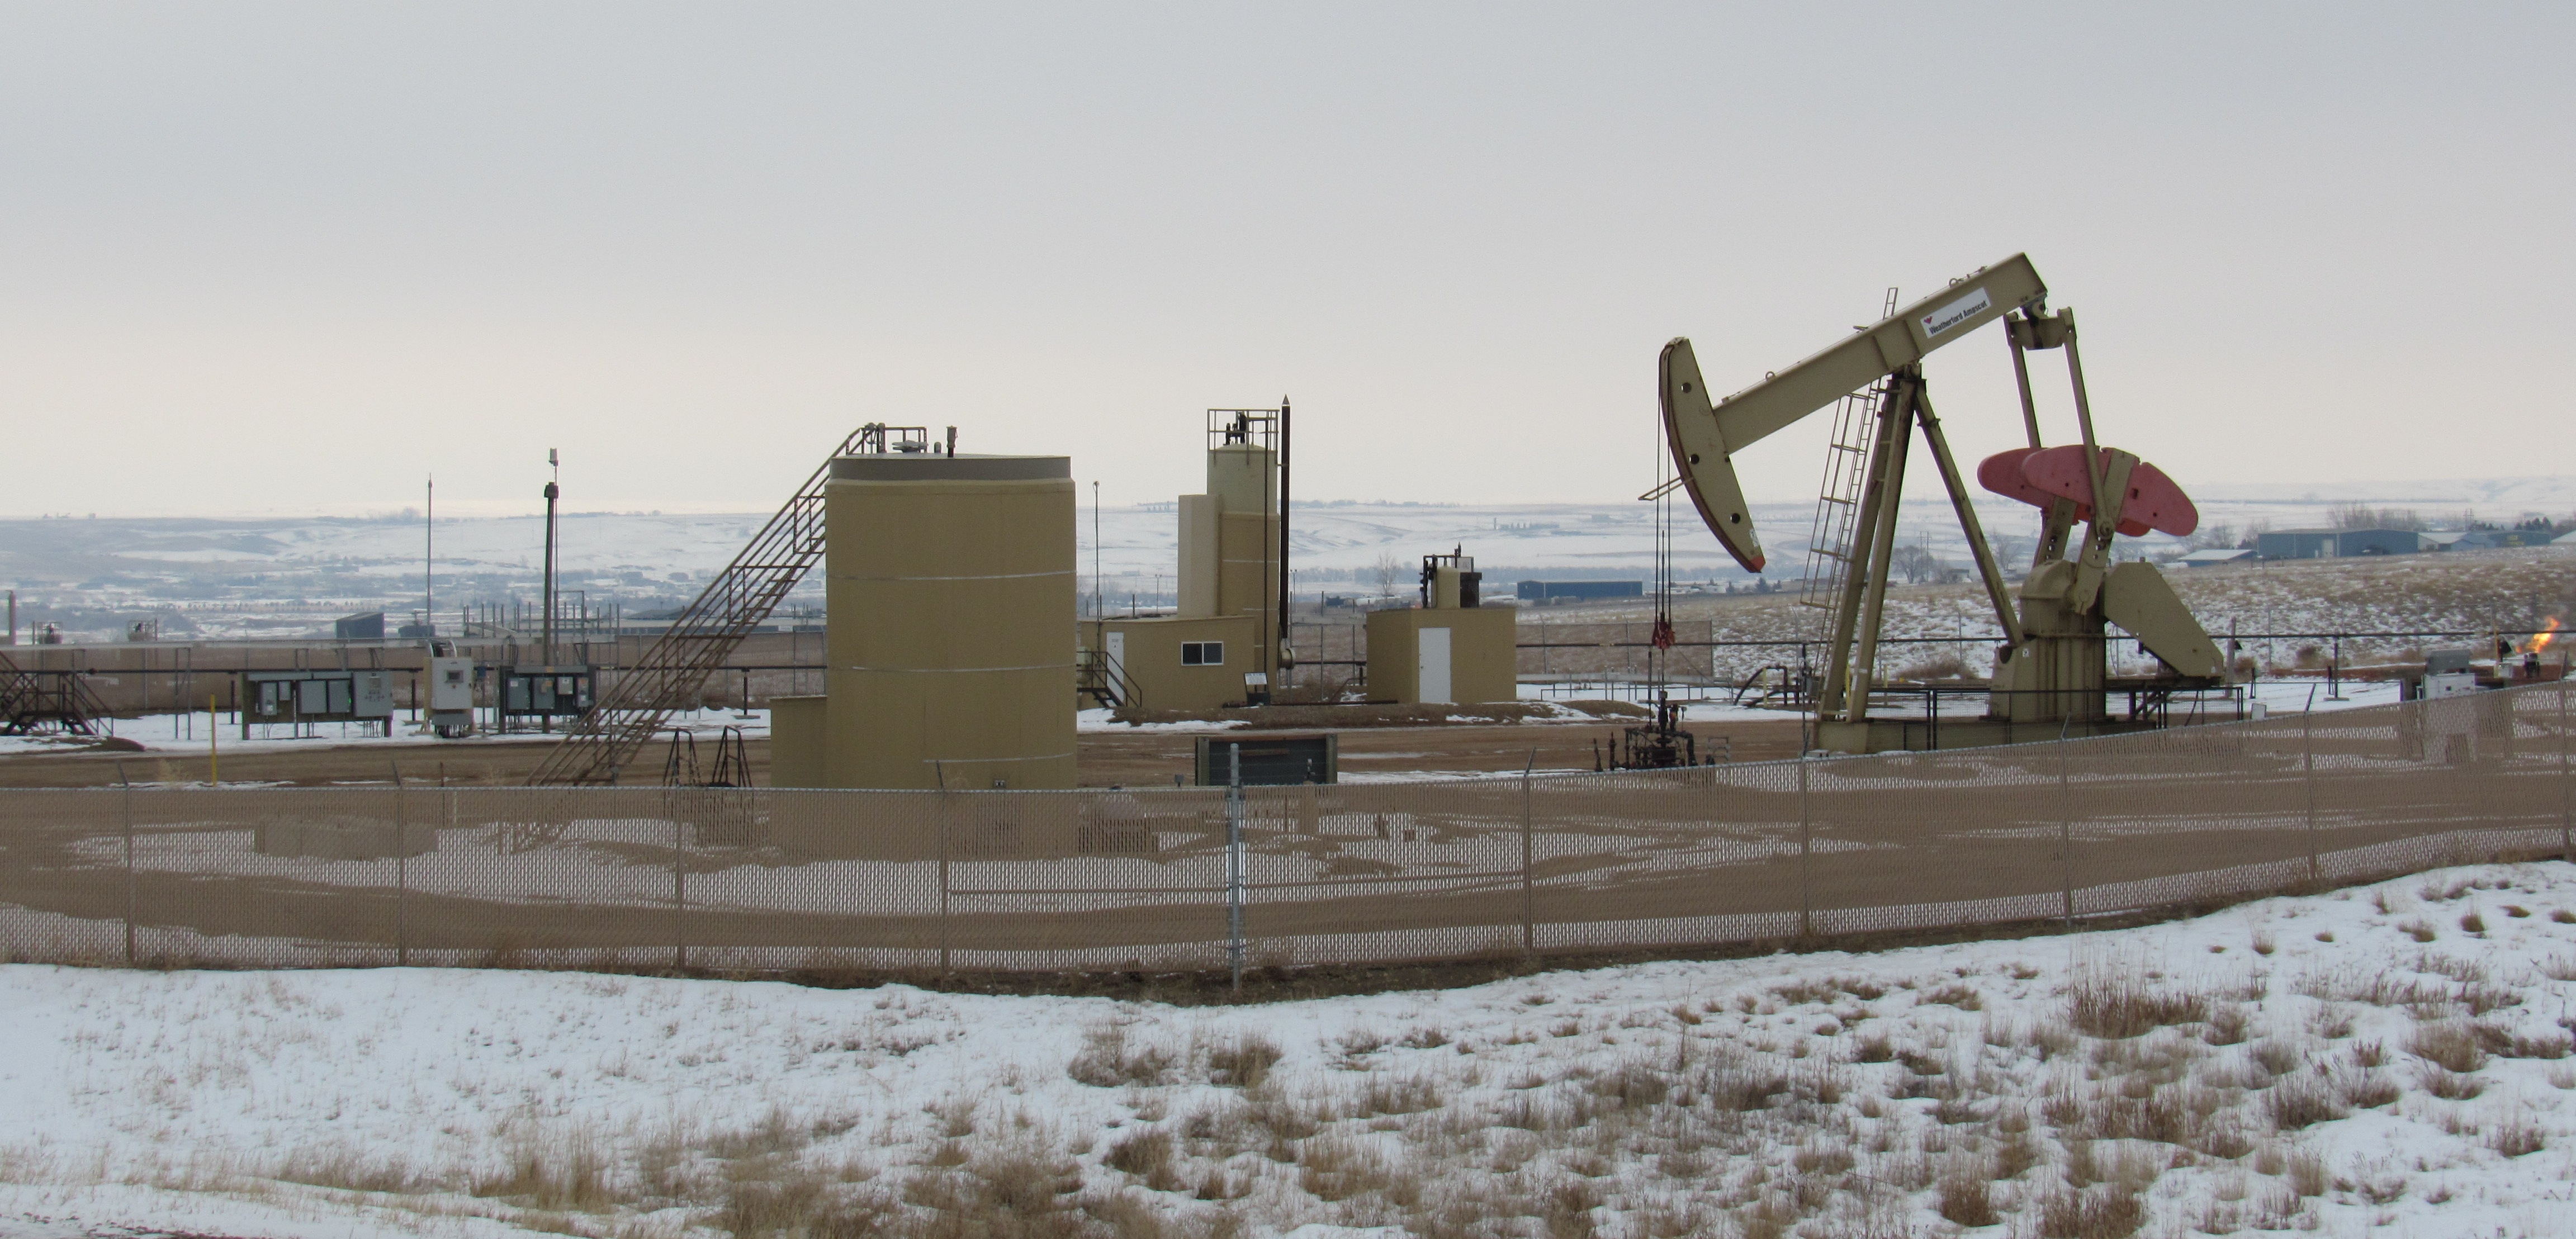
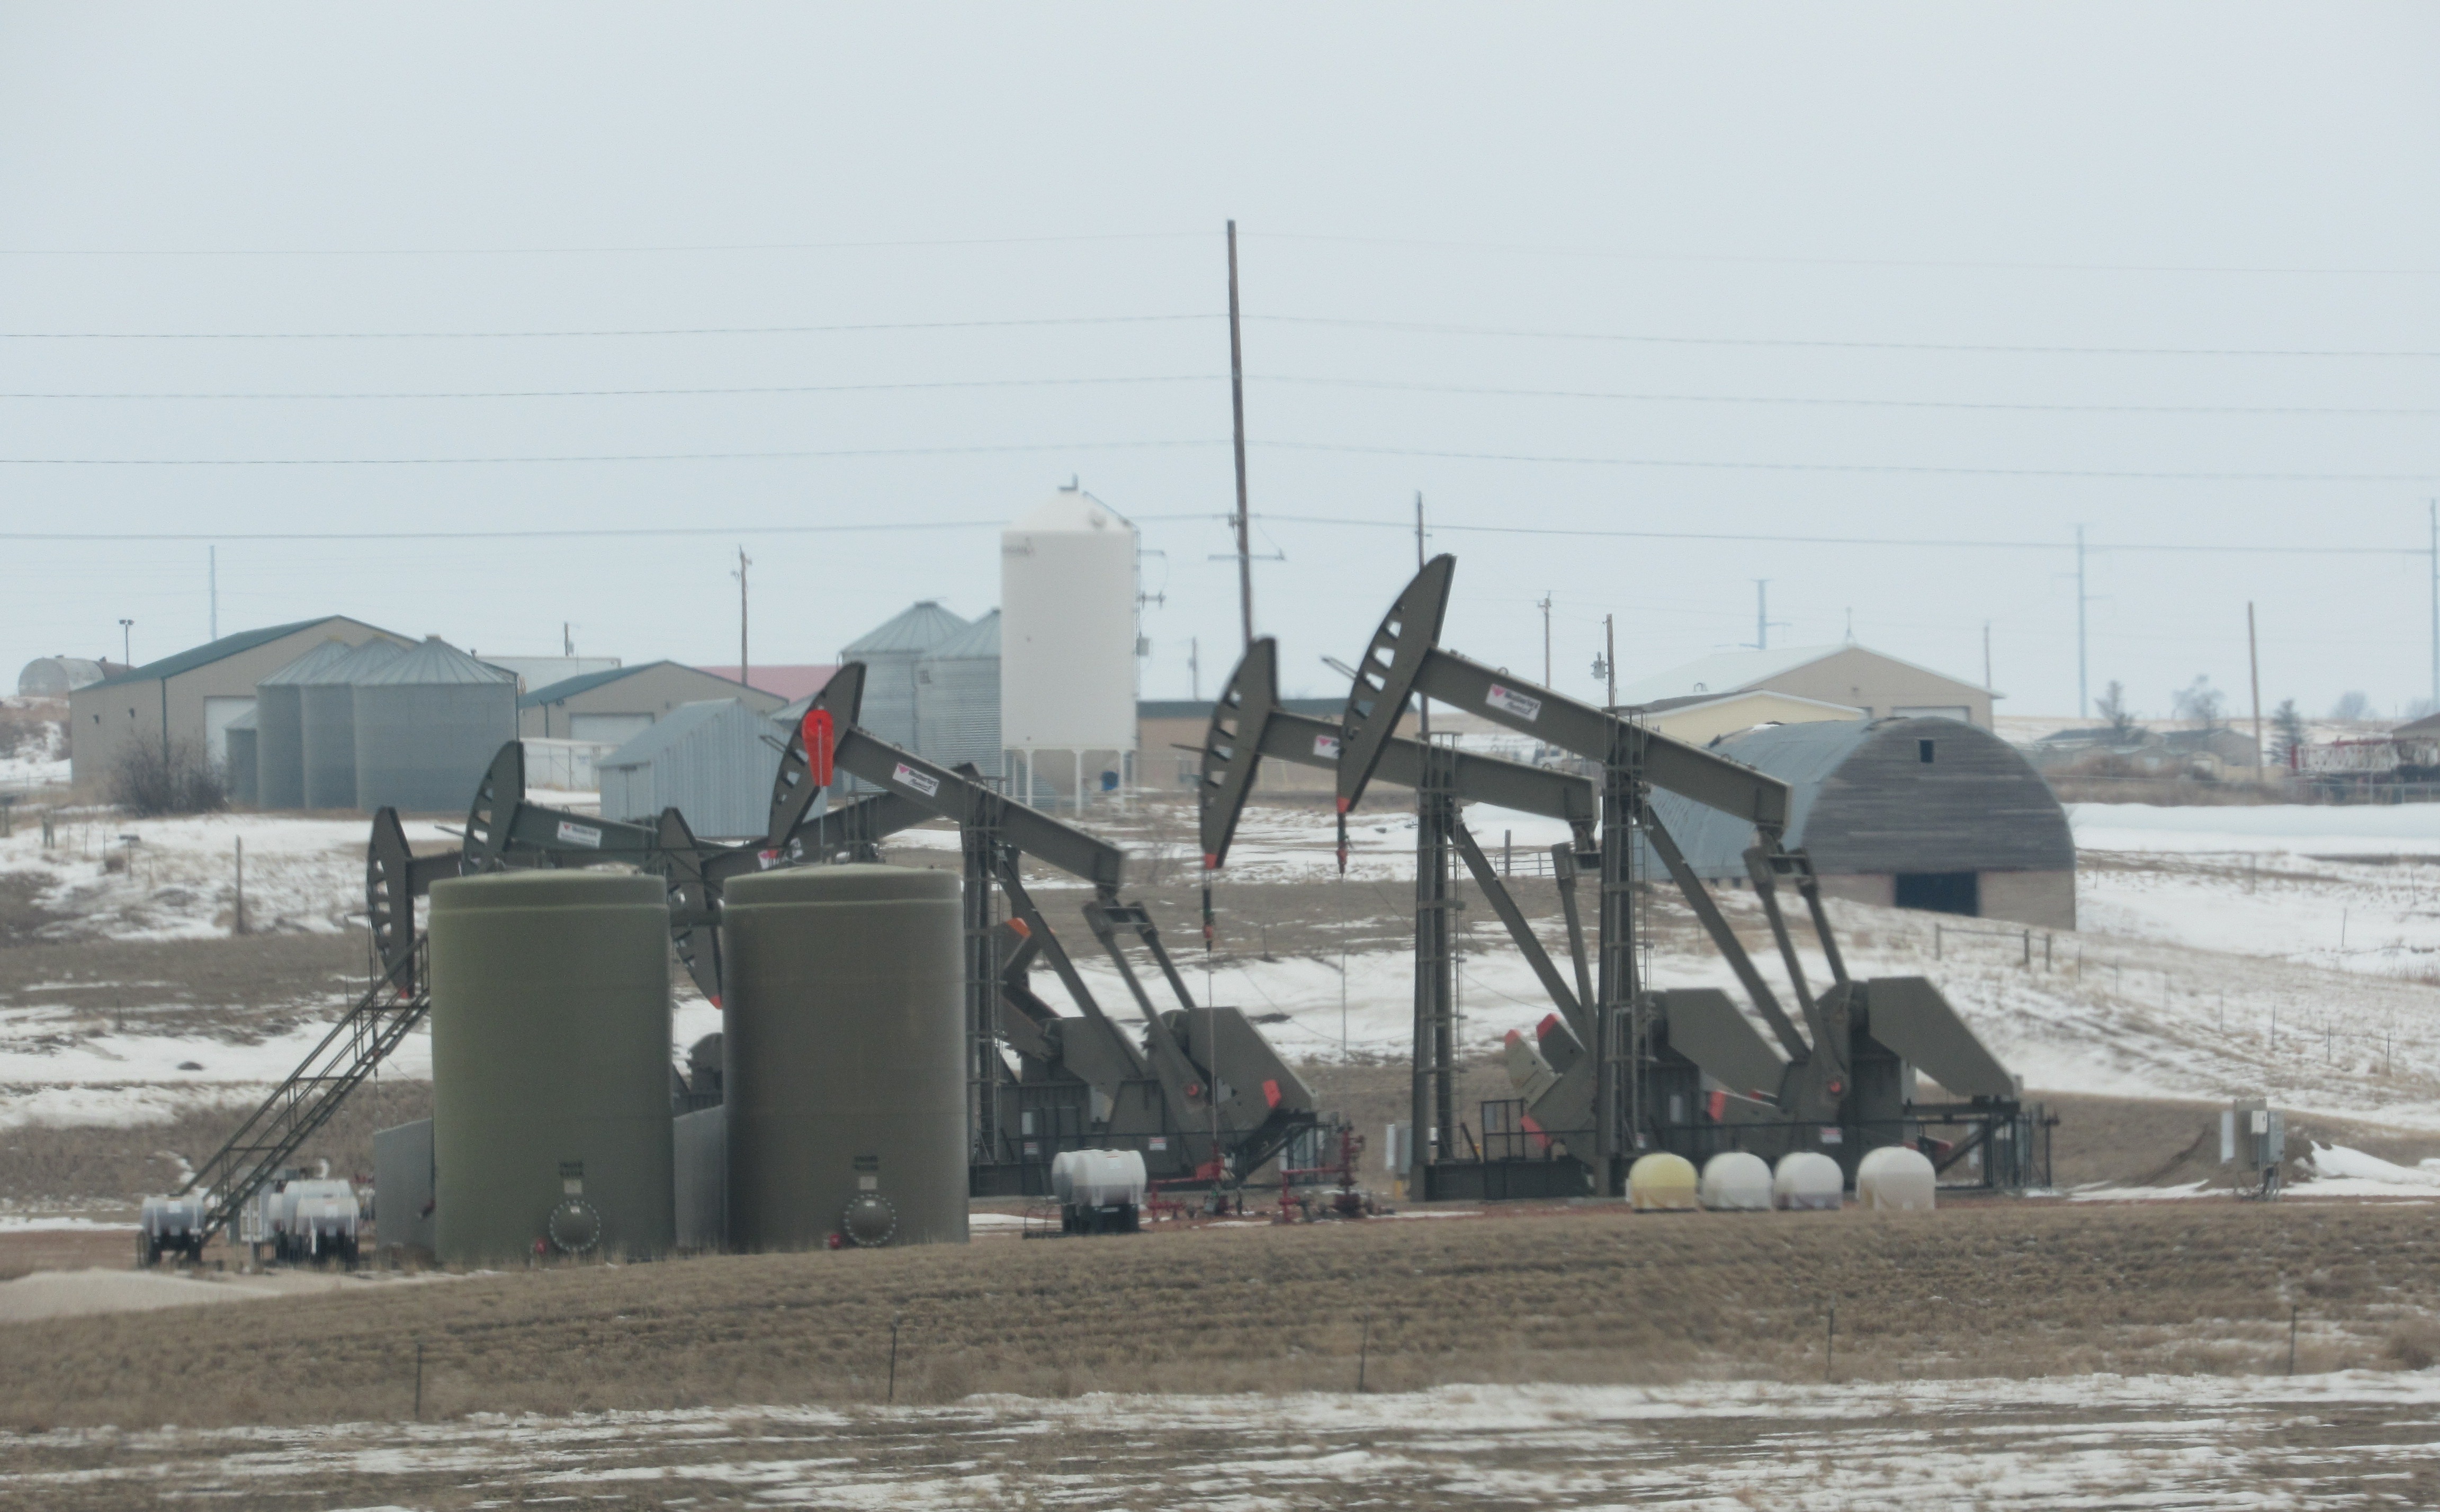
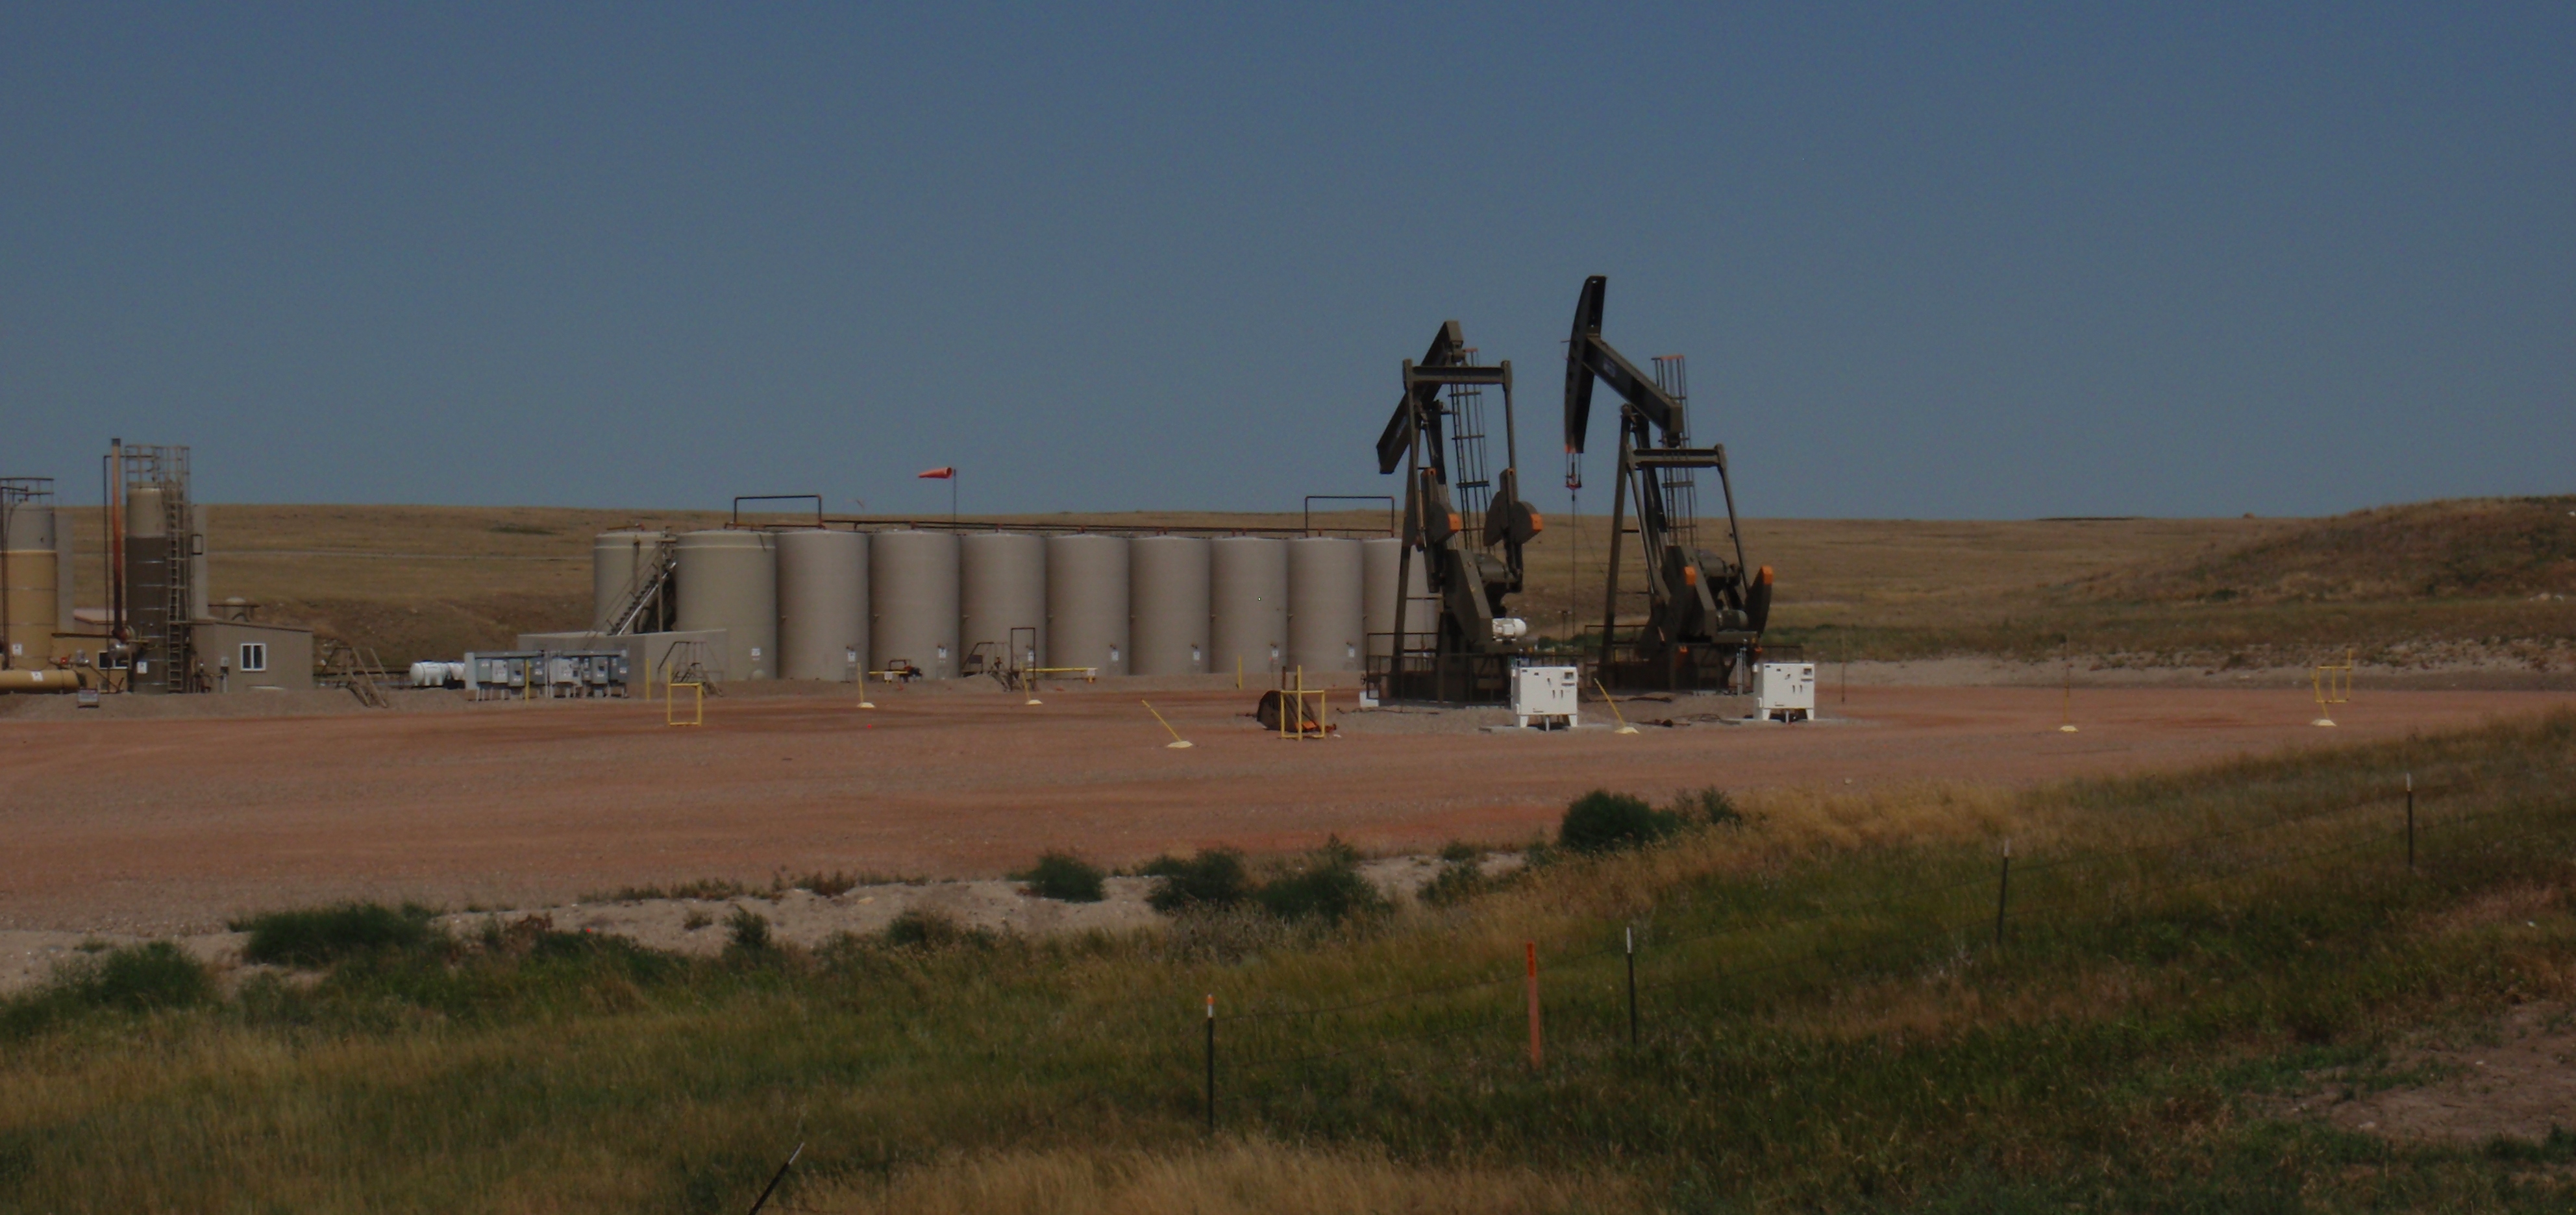
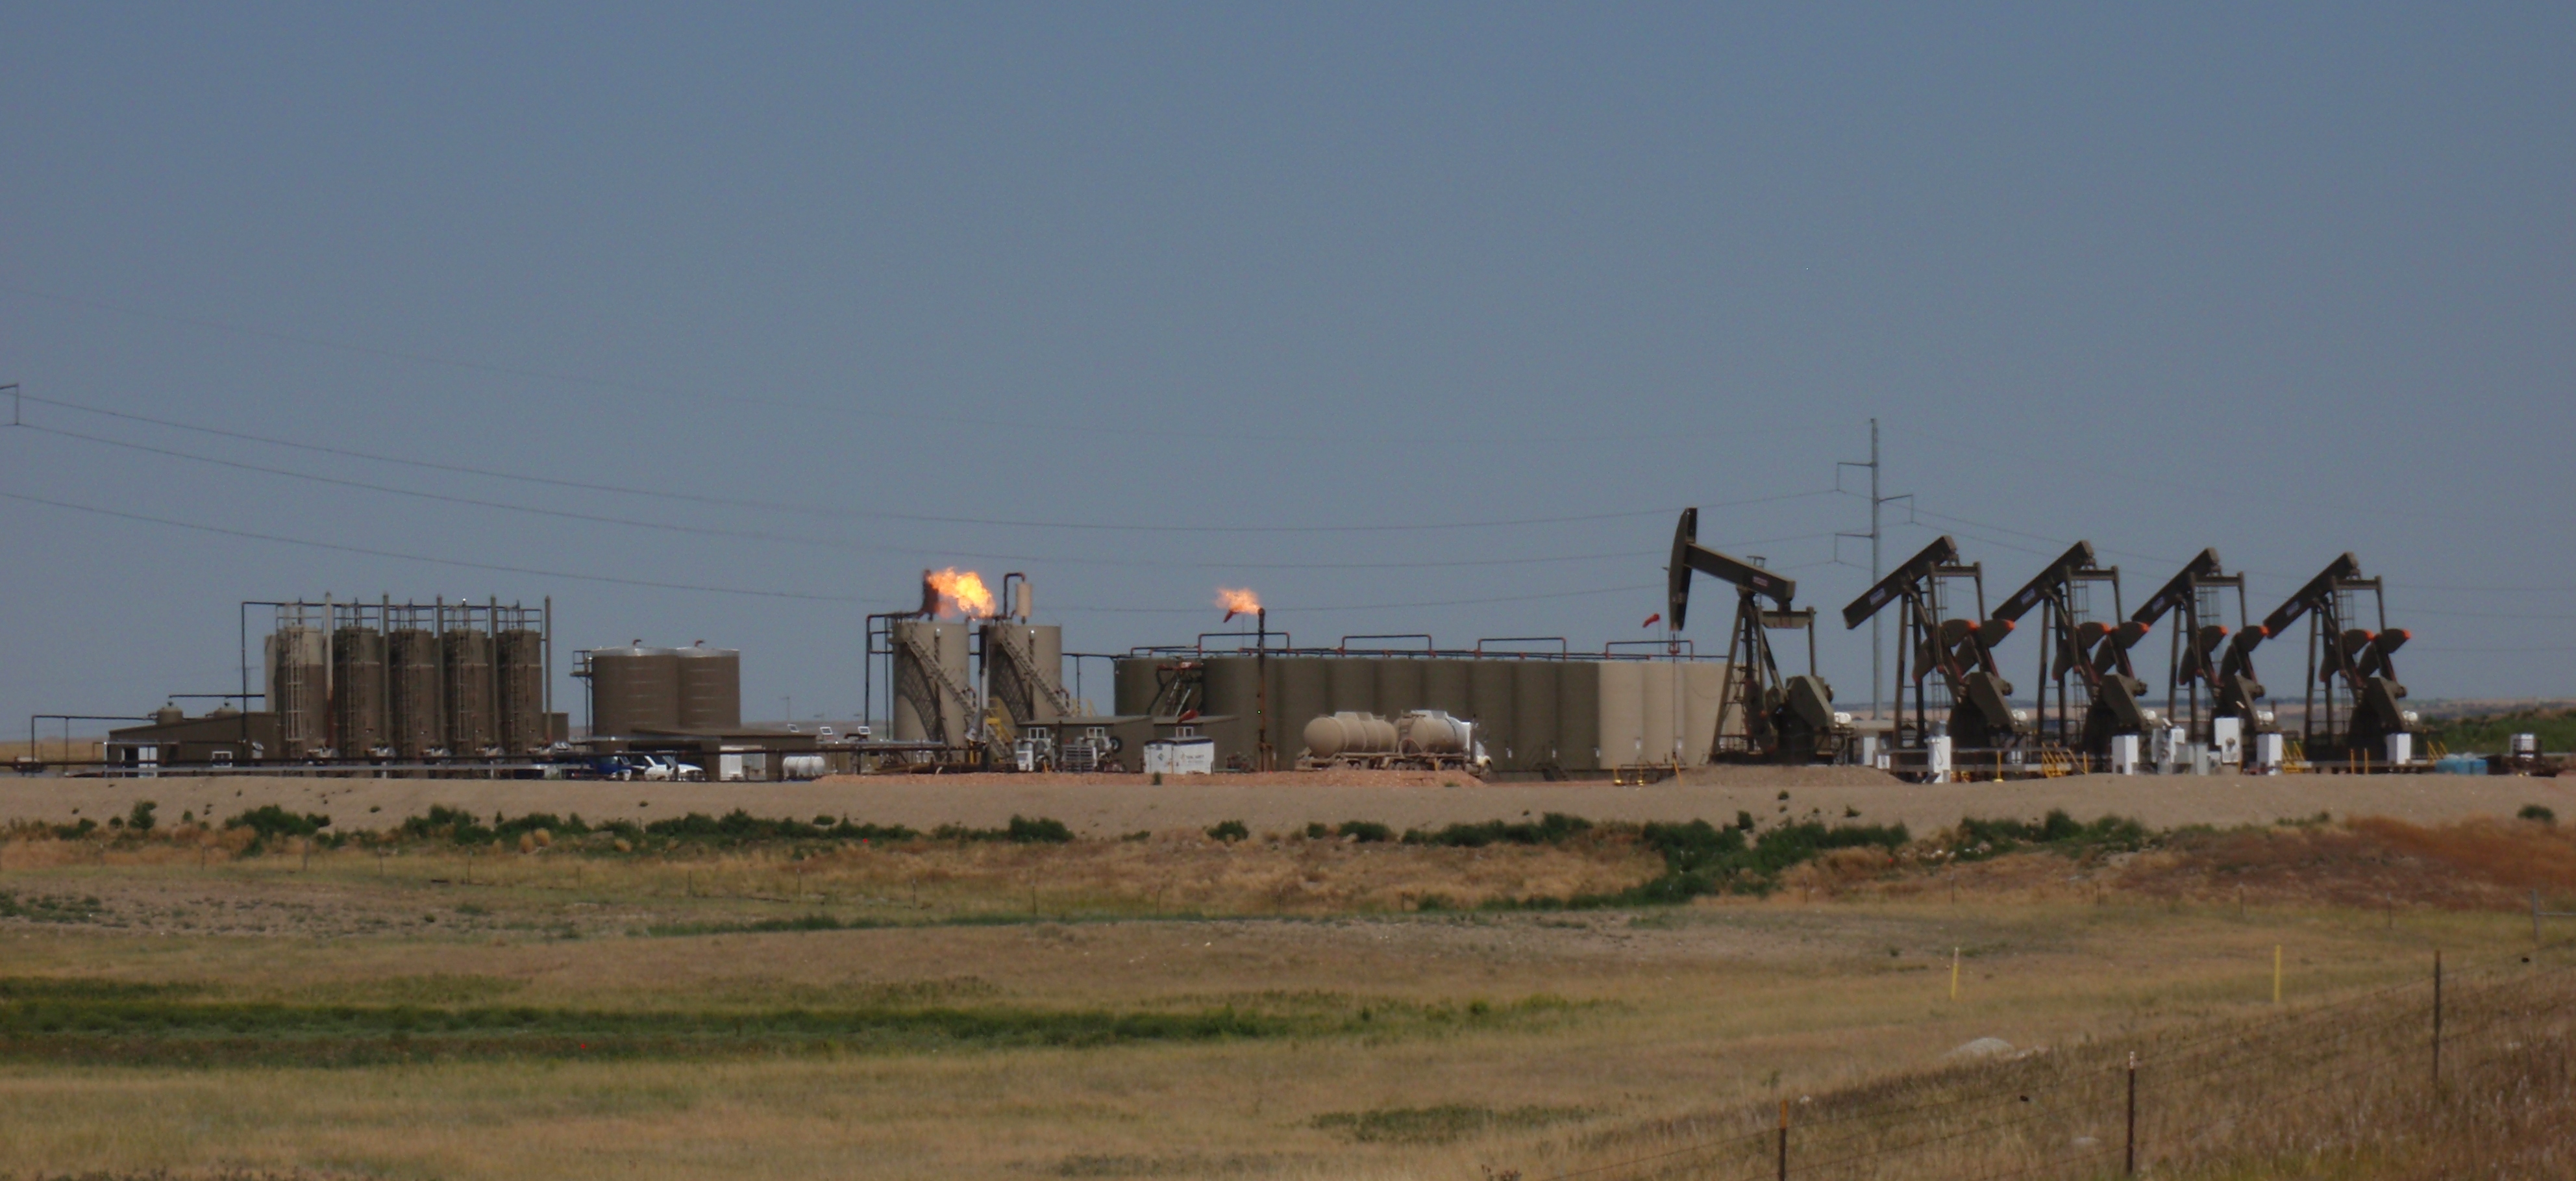
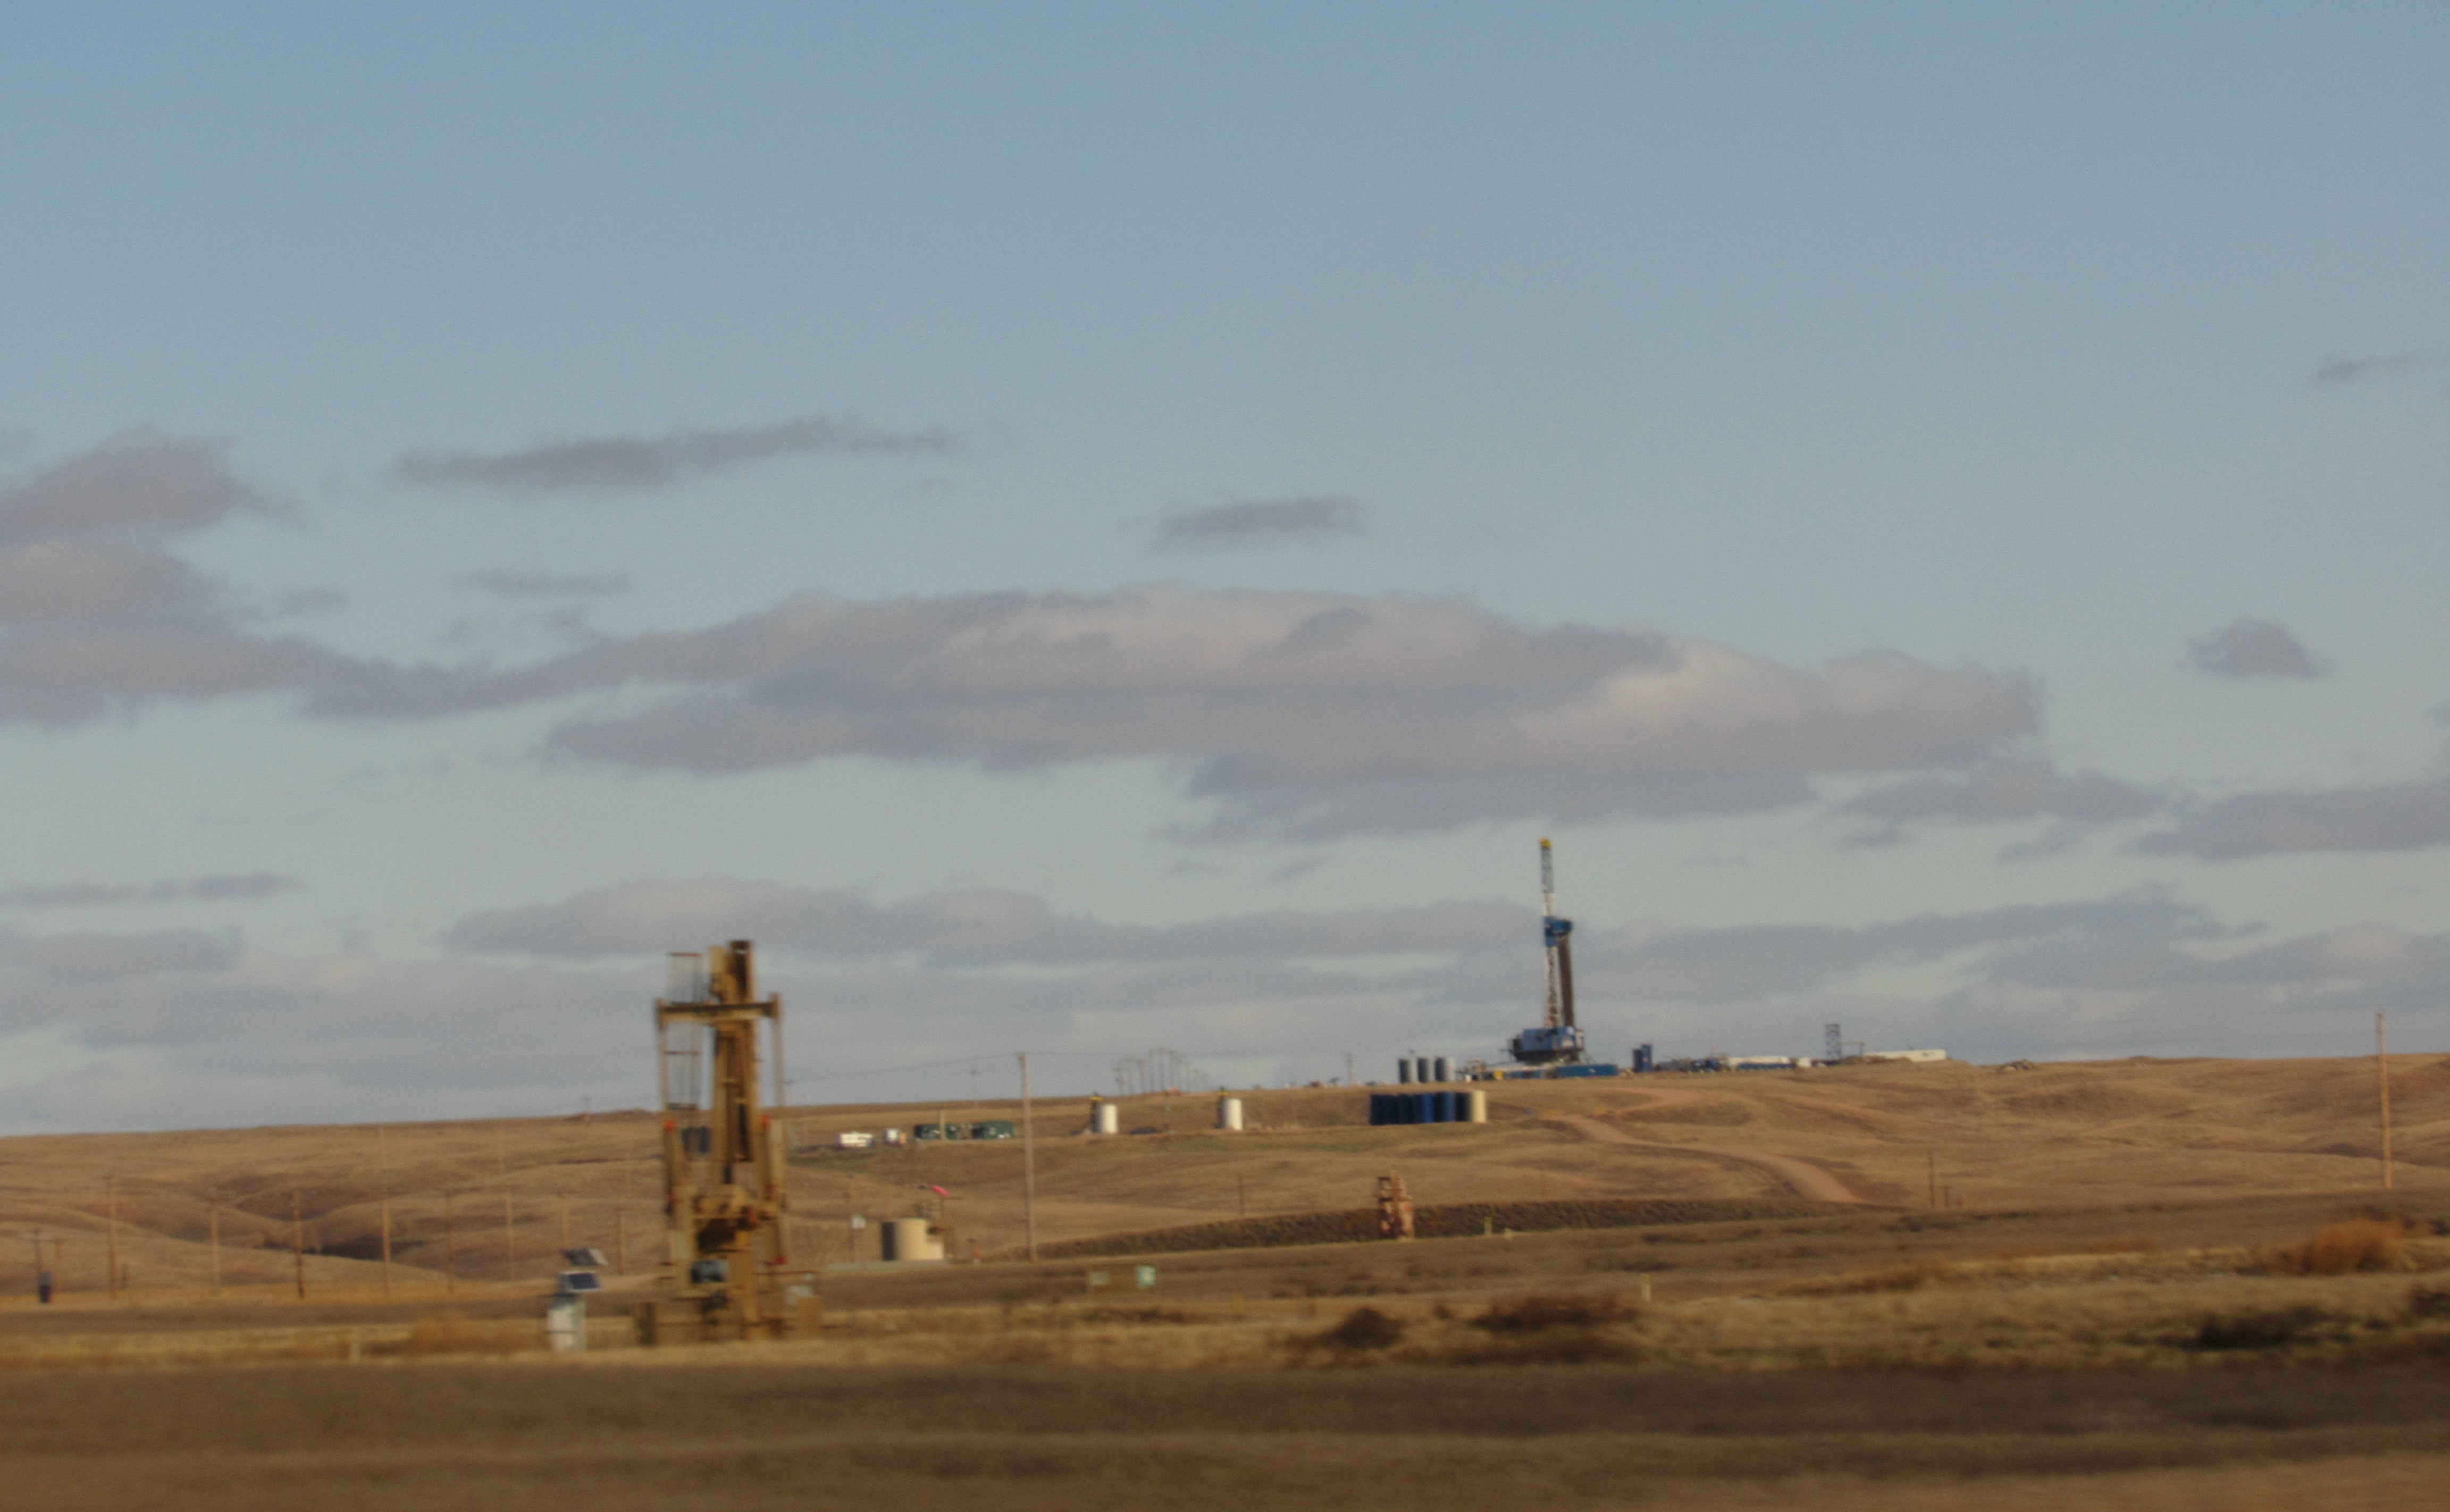
Producing well with pumpjack in the foreground. Drilling rig in background. Two more pads between them.  Photo by James Ulvog.

Release of the December production data in North Dakota lets us look at production for the full year.  Following graphs show the average daily production and total for the year. Multiplying the monthly data by the sweet crude price in North Dakota reported in the Director’s Cut lets us see the value of production by month and total value for the year.

Continue reading “Oil production in North Dakota for 2019.”

In July 2019, North Dakota oil production breaks record for second month in a row.

Four of the reasons oil prices are *not* completely crazy after the attack on Saudi Arabia’s processing facilities this past weekend. Photo by James Ulvog.

The Million Dollar Way blog points out With The July, 2019, Data, North Dakota Set Four New All-Time Records.

In July, the state energy wizards set four record levels of production:

  • Crude oil
  • Gas
  • Barrels of oil equivalent (converting gas into equivalent amount of oil and combining with crude production)
  • Number of producing wells

Breaking production records in North Dakota, New Mexico, and Texas is something to celebrate if you like being able to get gasoline for your car whenever you feel like doing so, or if you like having gas available at reasonable prices in spite of when, oh, say, someone drops a bunch of bombs on Saudi production facilities.

Continue reading “In July 2019, North Dakota oil production breaks record for second month in a row.”

Volume of 2018 oil production in North Dakota hits another record; total value rising.

Photo by James Ulvog.

Total production of oil in North Dakota in 2018 set a record as did the average daily production.  Prices have recovered from their low which means the value of that production is going up but not yet close to setting a record.

All of the following data is from a spreadsheet I maintain, with the raw data pulled from various reports published by the North Dakota Department of Mineral Resources.

Average daily production rose to 1,249,049 bopd in 2018, up from 1,081,543 bopd in 2017. That is an increase of 167,505 bopd, or 15.5%. Previous record was 1,184,009 bopd in 2015.

Average daily production:


Total production for the year was 455,902,738 barrels, an increase of 61.1M barrels over the 394.8M produced in 2017.

Total production over the years:

Continue reading “Volume of 2018 oil production in North Dakota hits another record; total value rising.”

In 2018, North Dakota oil production broke record level of output 6 times during 8 months.

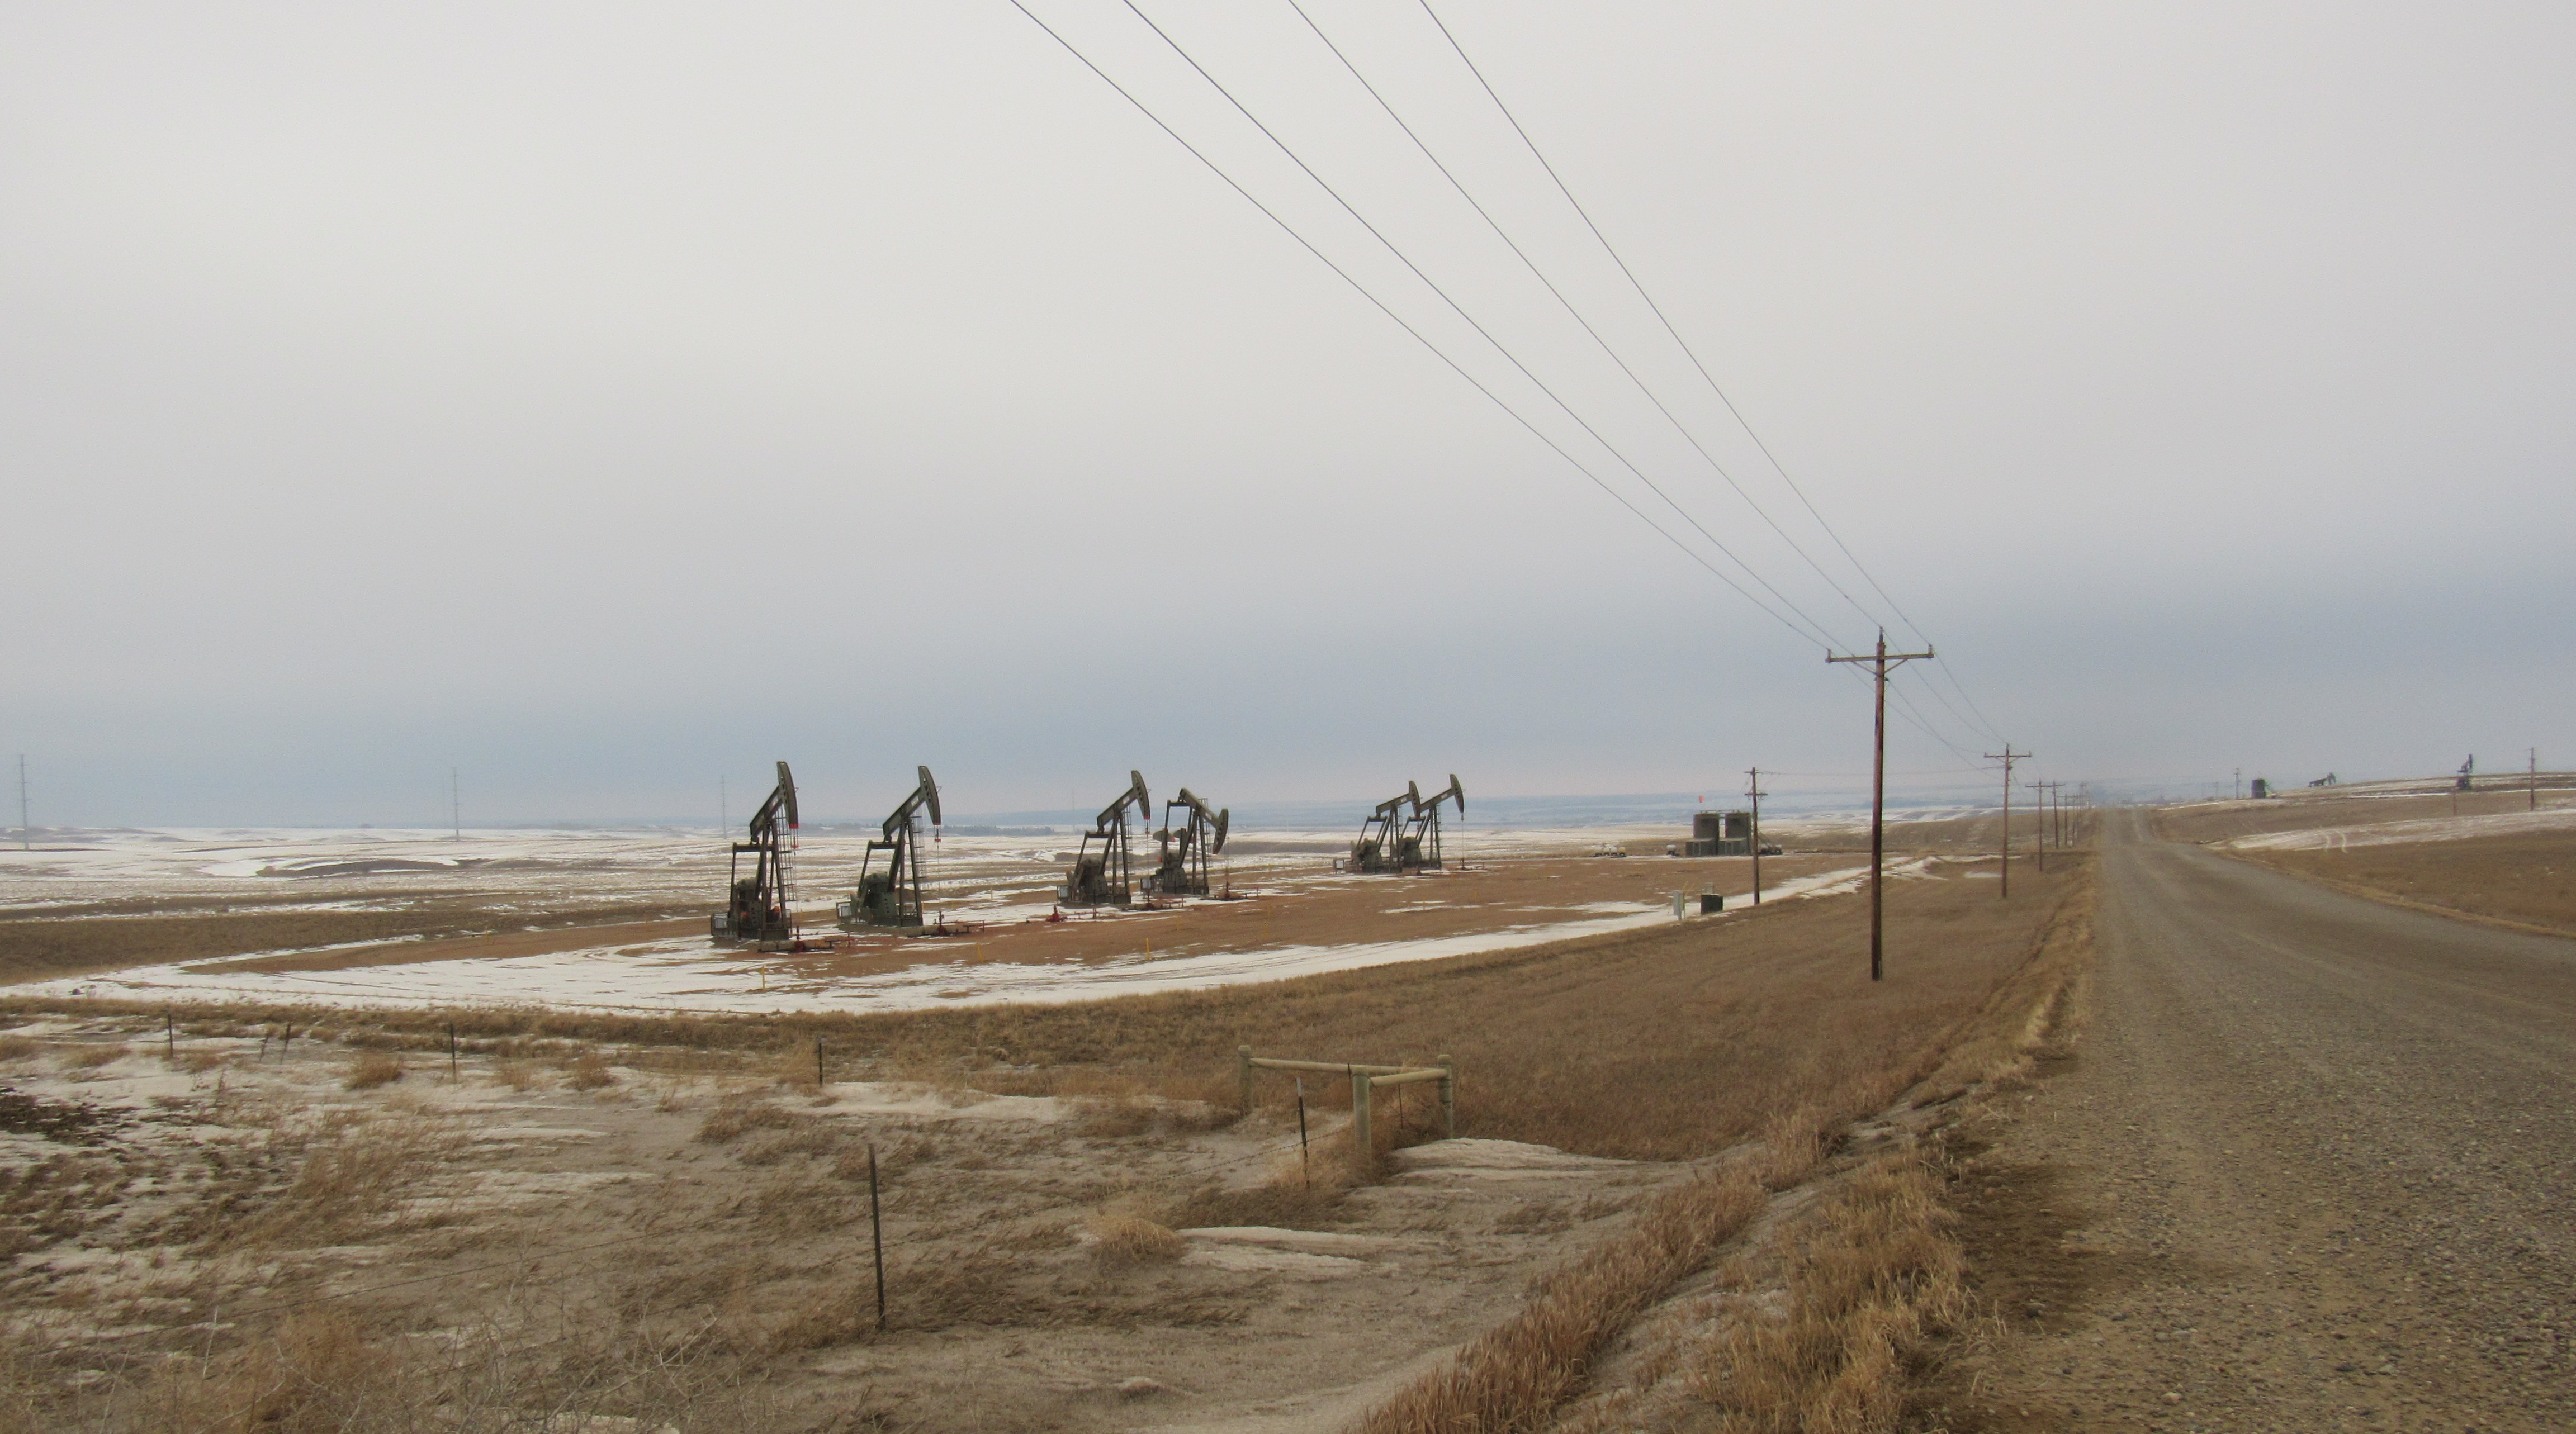
Two things to notice. Lots of space between pumpjacks means there will eventually be several more wells on that pad. Lack of any storage tanks means the pad is tied directly to an underground pipeline. Photo by James Ulvog.

Oil production in North Dakota hit an all time high of an average of 1,229,572 barrels of oil per day (bopd) back in December 2014.  The effort by Saudi Arabia to flood the market in order to drive down prices in order to collapse the US shale industry slowed production in North Dakota but didn’t succeed in killing the shale sector.

Output fell to a low of 942,322 bopd in December 2017. Output then started rising with a typical slowdown in winter of 2017/2018.  After the winter lull production again climbed.

In 2018, producers in North Dakota broke the record level of production six times in the last eight months. The record-breaking months:

Continue reading “In 2018, North Dakota oil production broke record level of output 6 times during 8 months.”

Drilling and completion results in North Dakota through October 2018

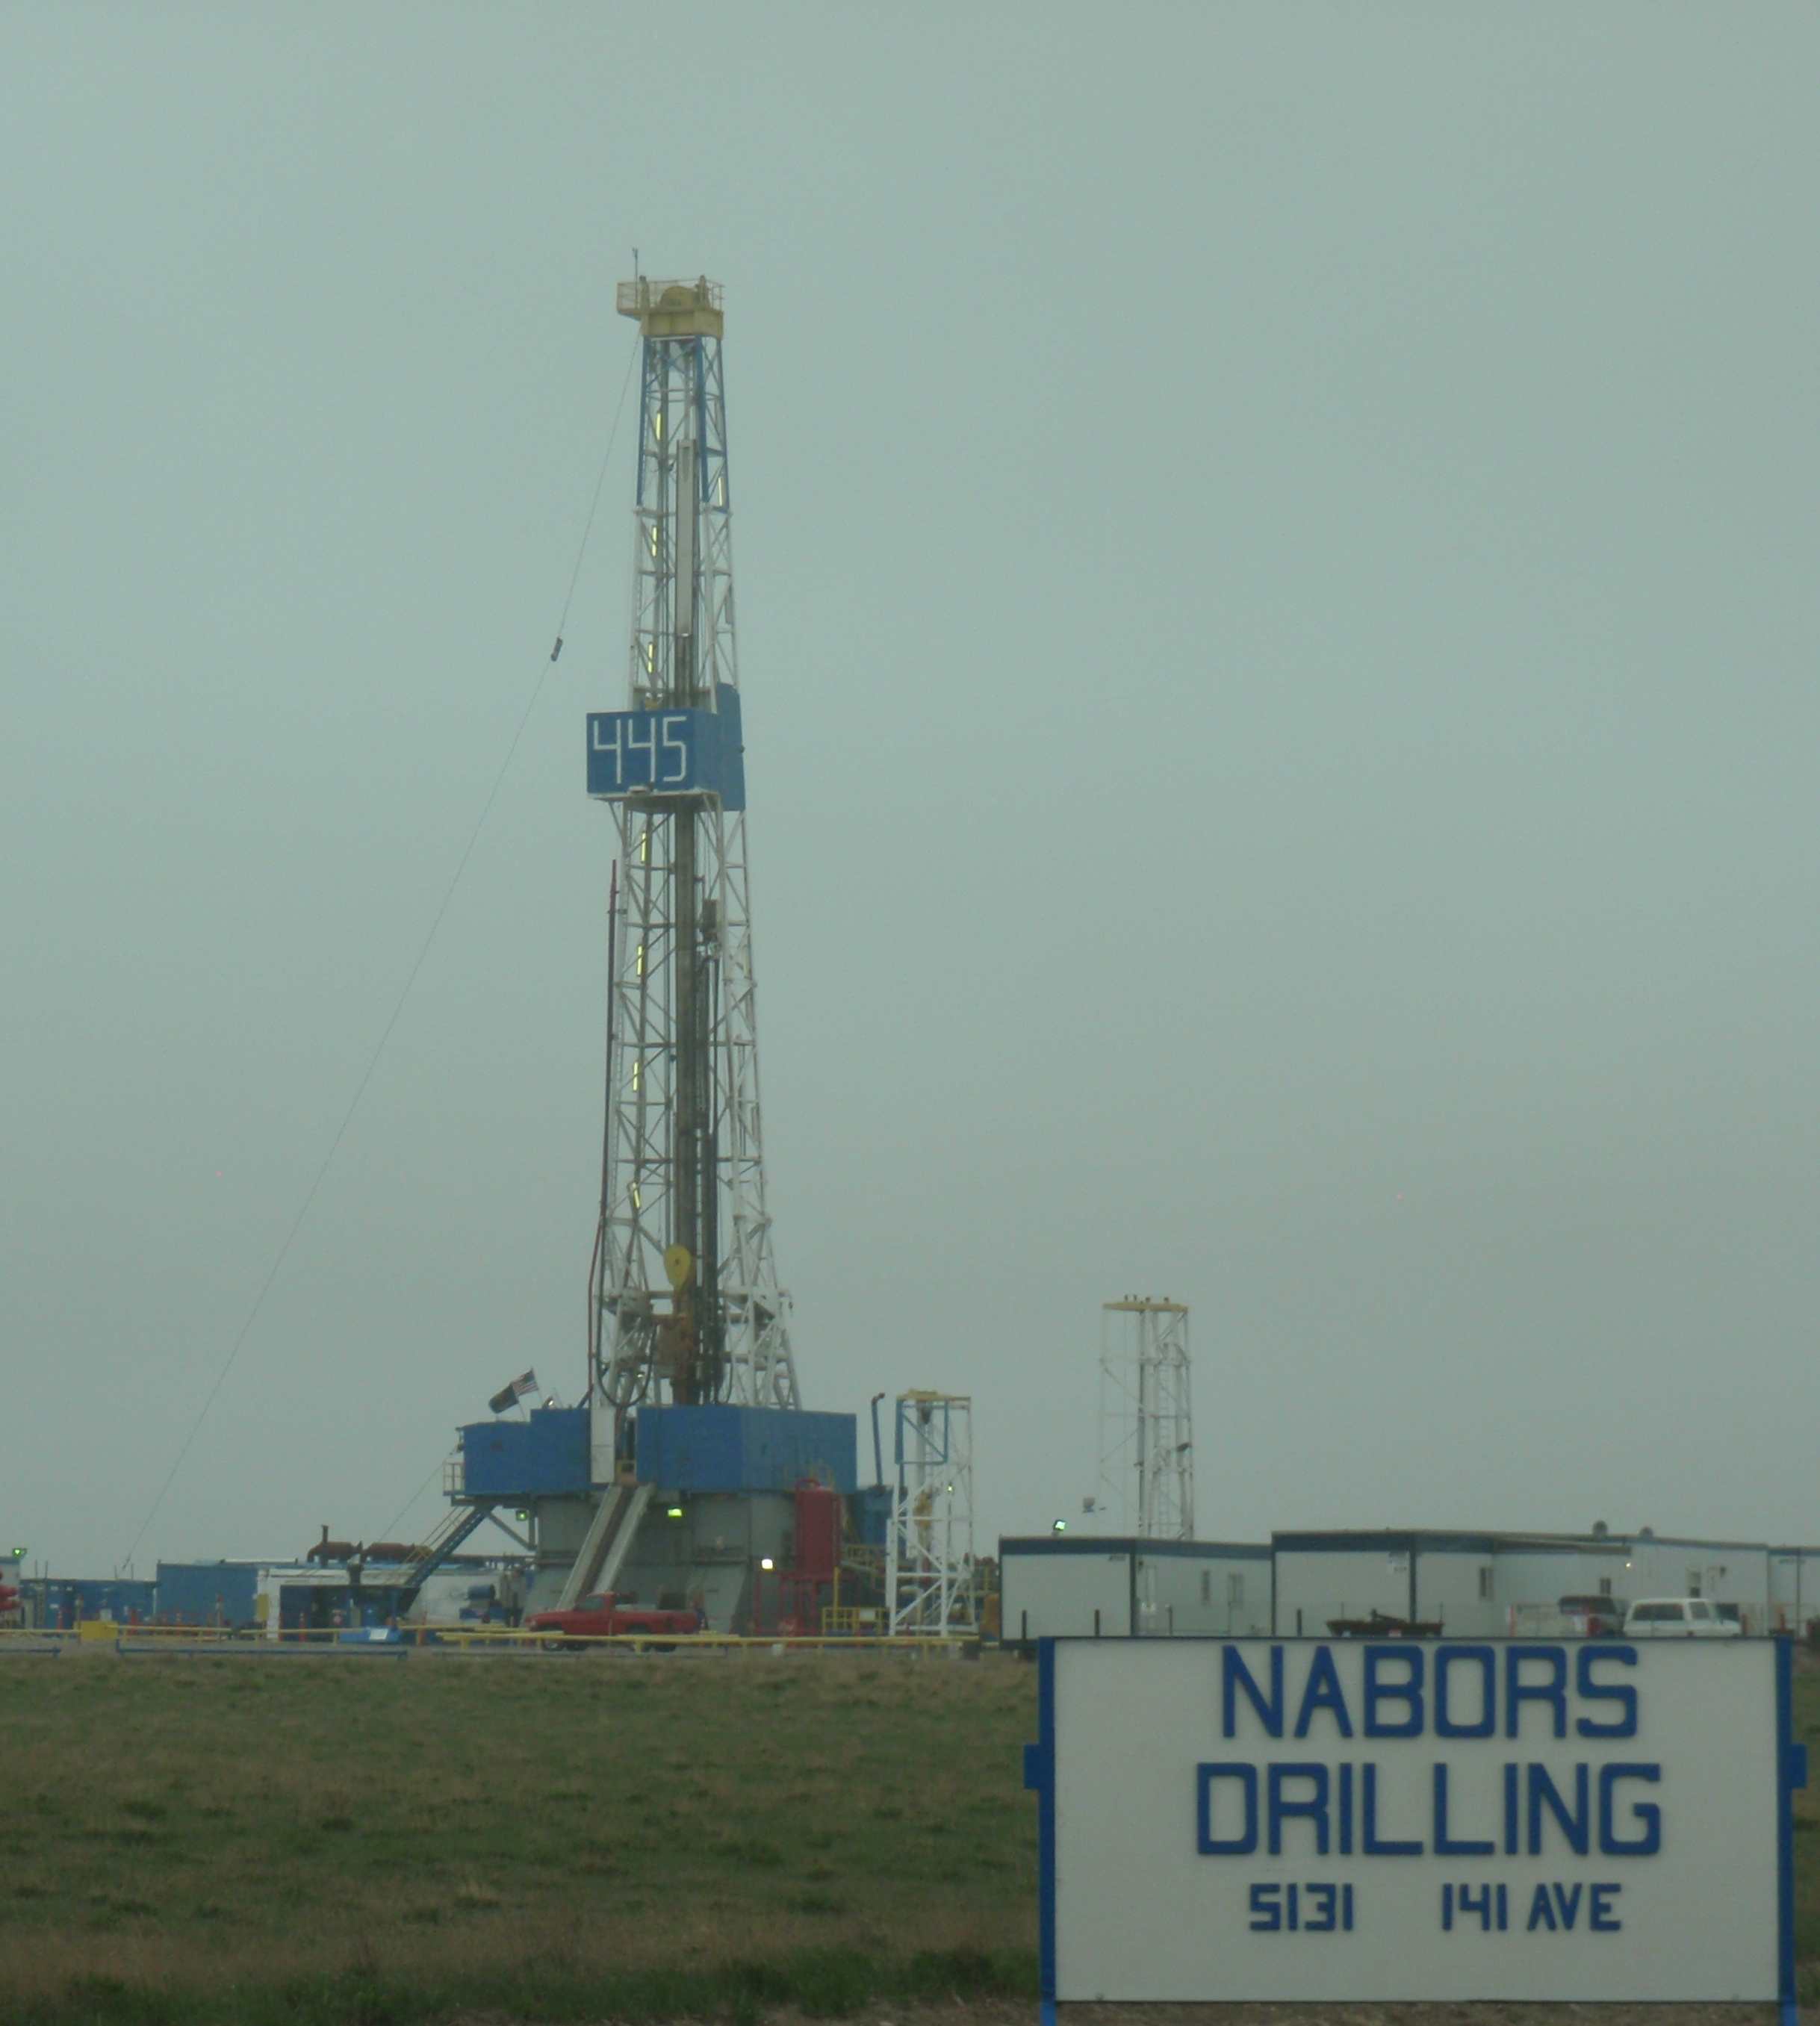
Drilling rig used for training by Nabors Drilling. Photo by James Ulvog.

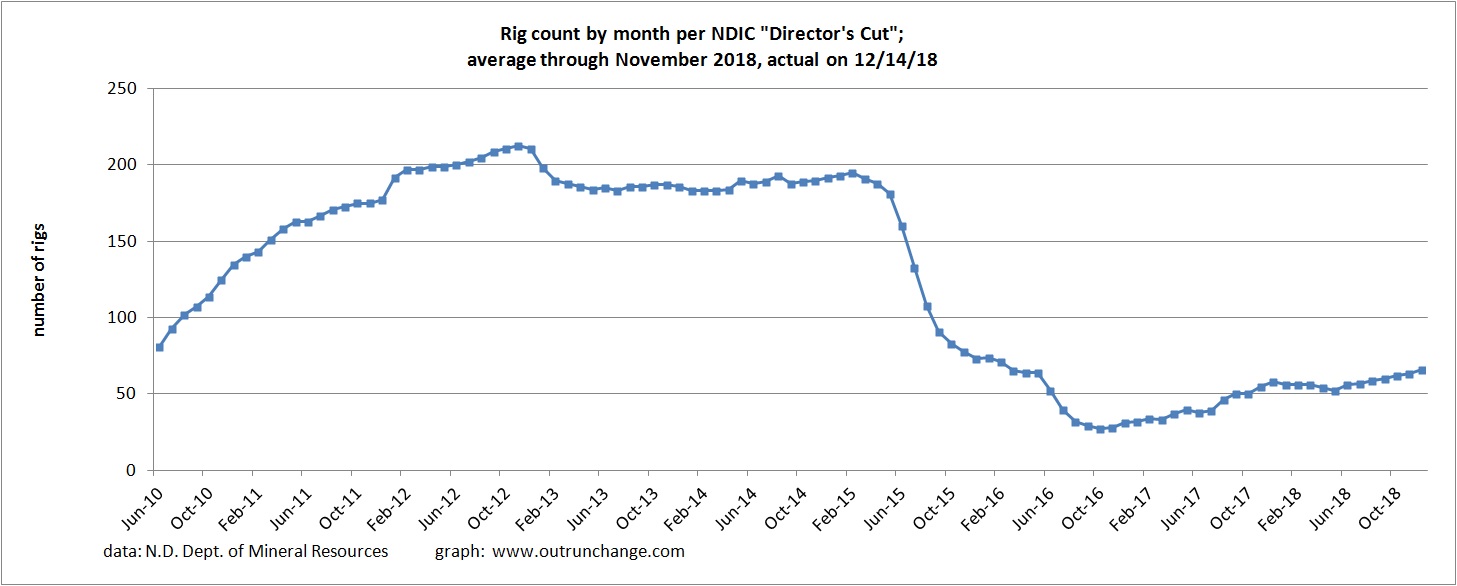
For some details on the production effort behind the rise in oil production in North Dakota, check out the number of rigs in operation and some indications of the results.

Number of rigs has been trending up since late 2016. This is response to increasing oil prices. The rig count dropped dramatically in 2015, which was OPEC’s goal in dropping prices. The drastic increases in efficiency of drilling mean the count of rigs in 2012 through 2014 is not comparable to the current count. Probably should be in two different graphs.


With the recent drop in prices, a larger number of the drilled wells are not immediately completed. Instead they are put in the fracklog category, essentially placed on the shelf as inventory awaiting completion until prices rise.

Continue reading “Drilling and completion results in North Dakota through October 2018”

Estimated value of oil production in North Dakota through October 2018

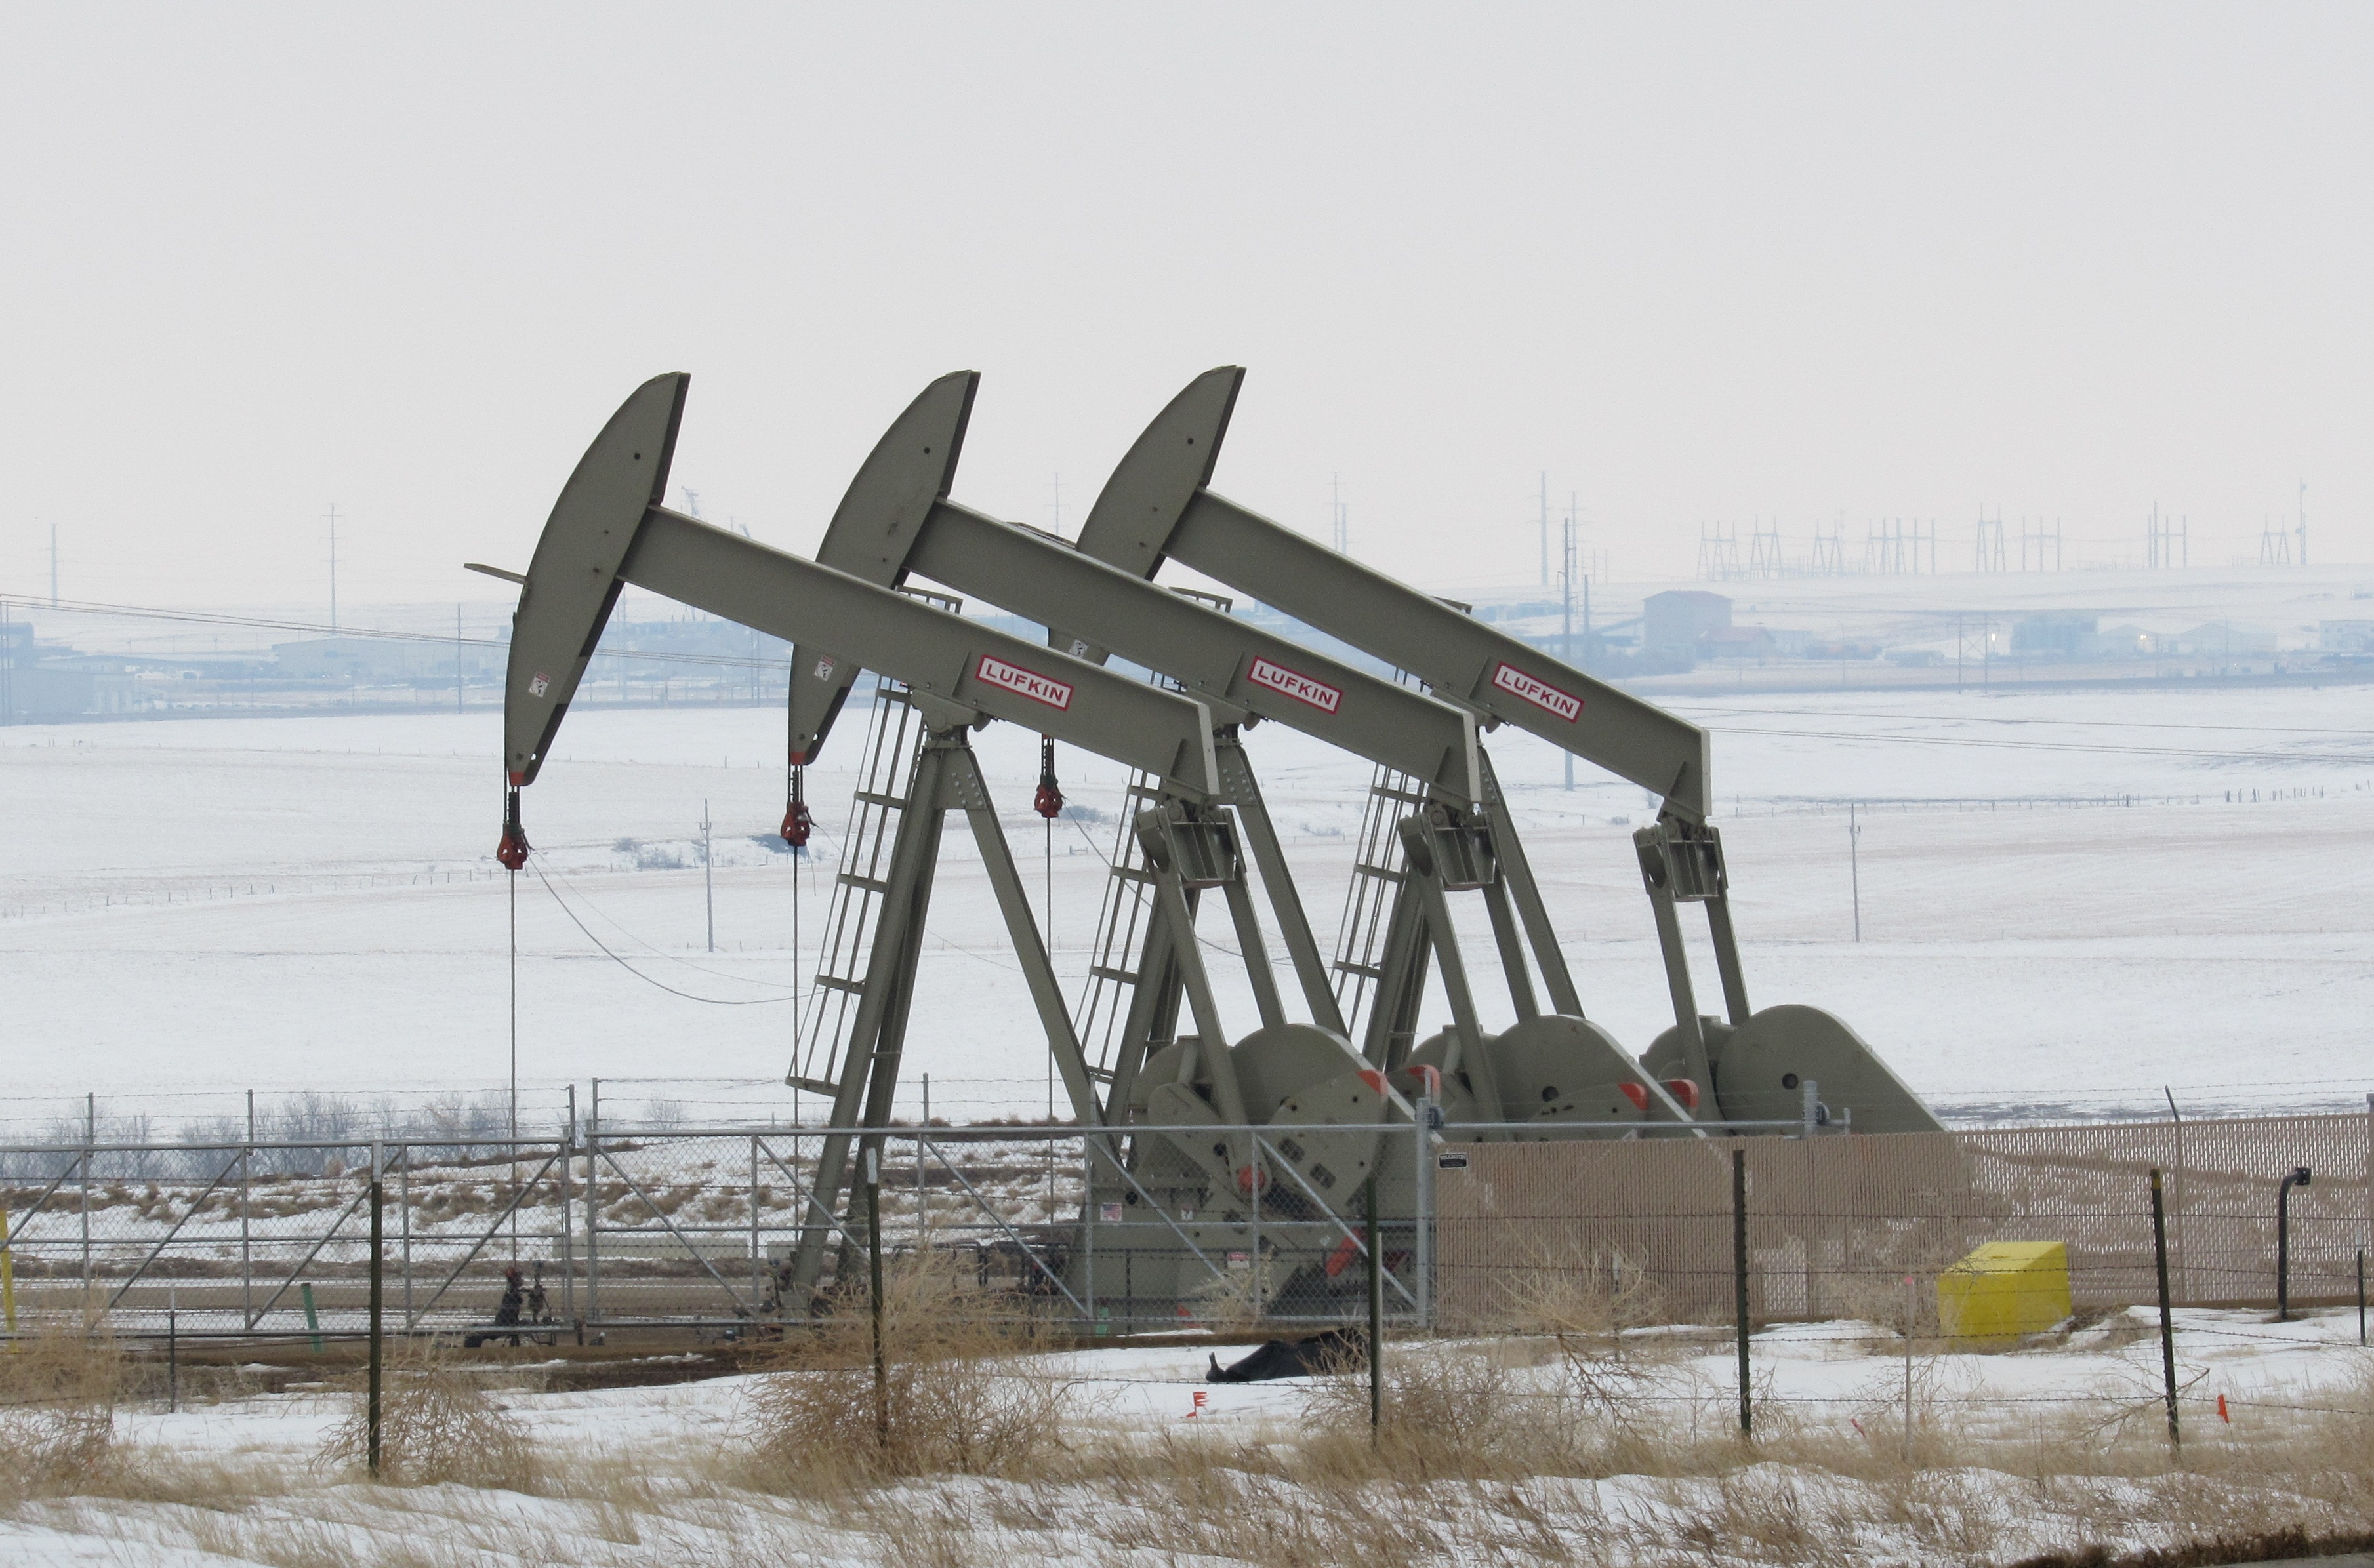
Photo by James Ulvog.

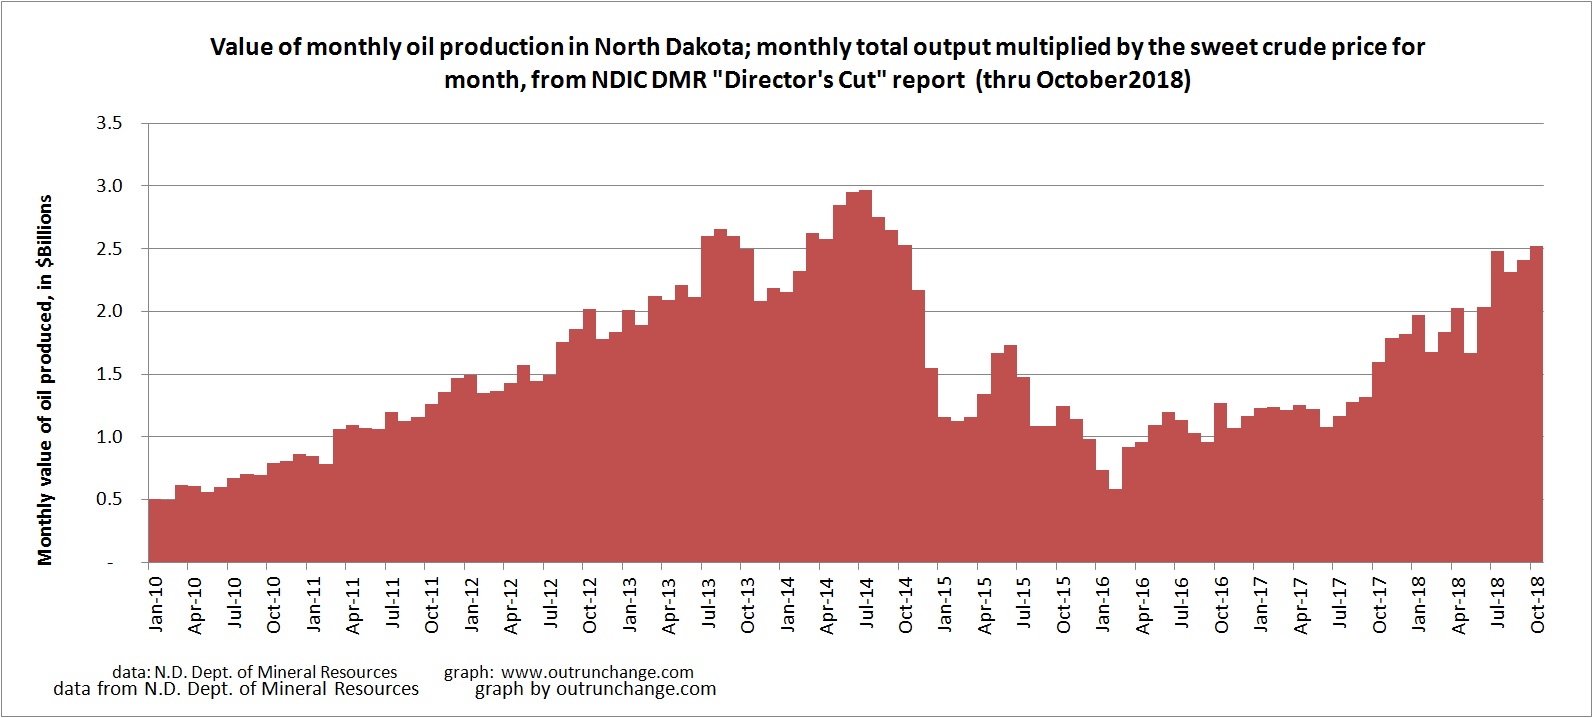
Production of oil in North Dakota has been shooting up. Prices have dropped recently. What does that look like in terms of the value of oil produced?

Multiplying the monthly production by the average sweet prices in the state results in the following estimated value of monthly production in the state:


There is a discount in sweet crude prices in the state compared to West Texas Intermediate due to transportation cost.  The prices realized in North Dakota are:

Continue reading “Estimated value of oil production in North Dakota through October 2018”

North Dakota oil production hits another record in September 2018 and again in October

Photo by James Ulvog.

Average production rose 5.2% in September 2018, hitting a new record, then rose another 2.4% in October for another record level. The production in October was just under 1.4 million bopd.

At the end of 2017, production was 1,182,836 ave bopd. In September average was 1,359,284 (final) and October was 1,391,877 (prelim).

Some production graphs – – –

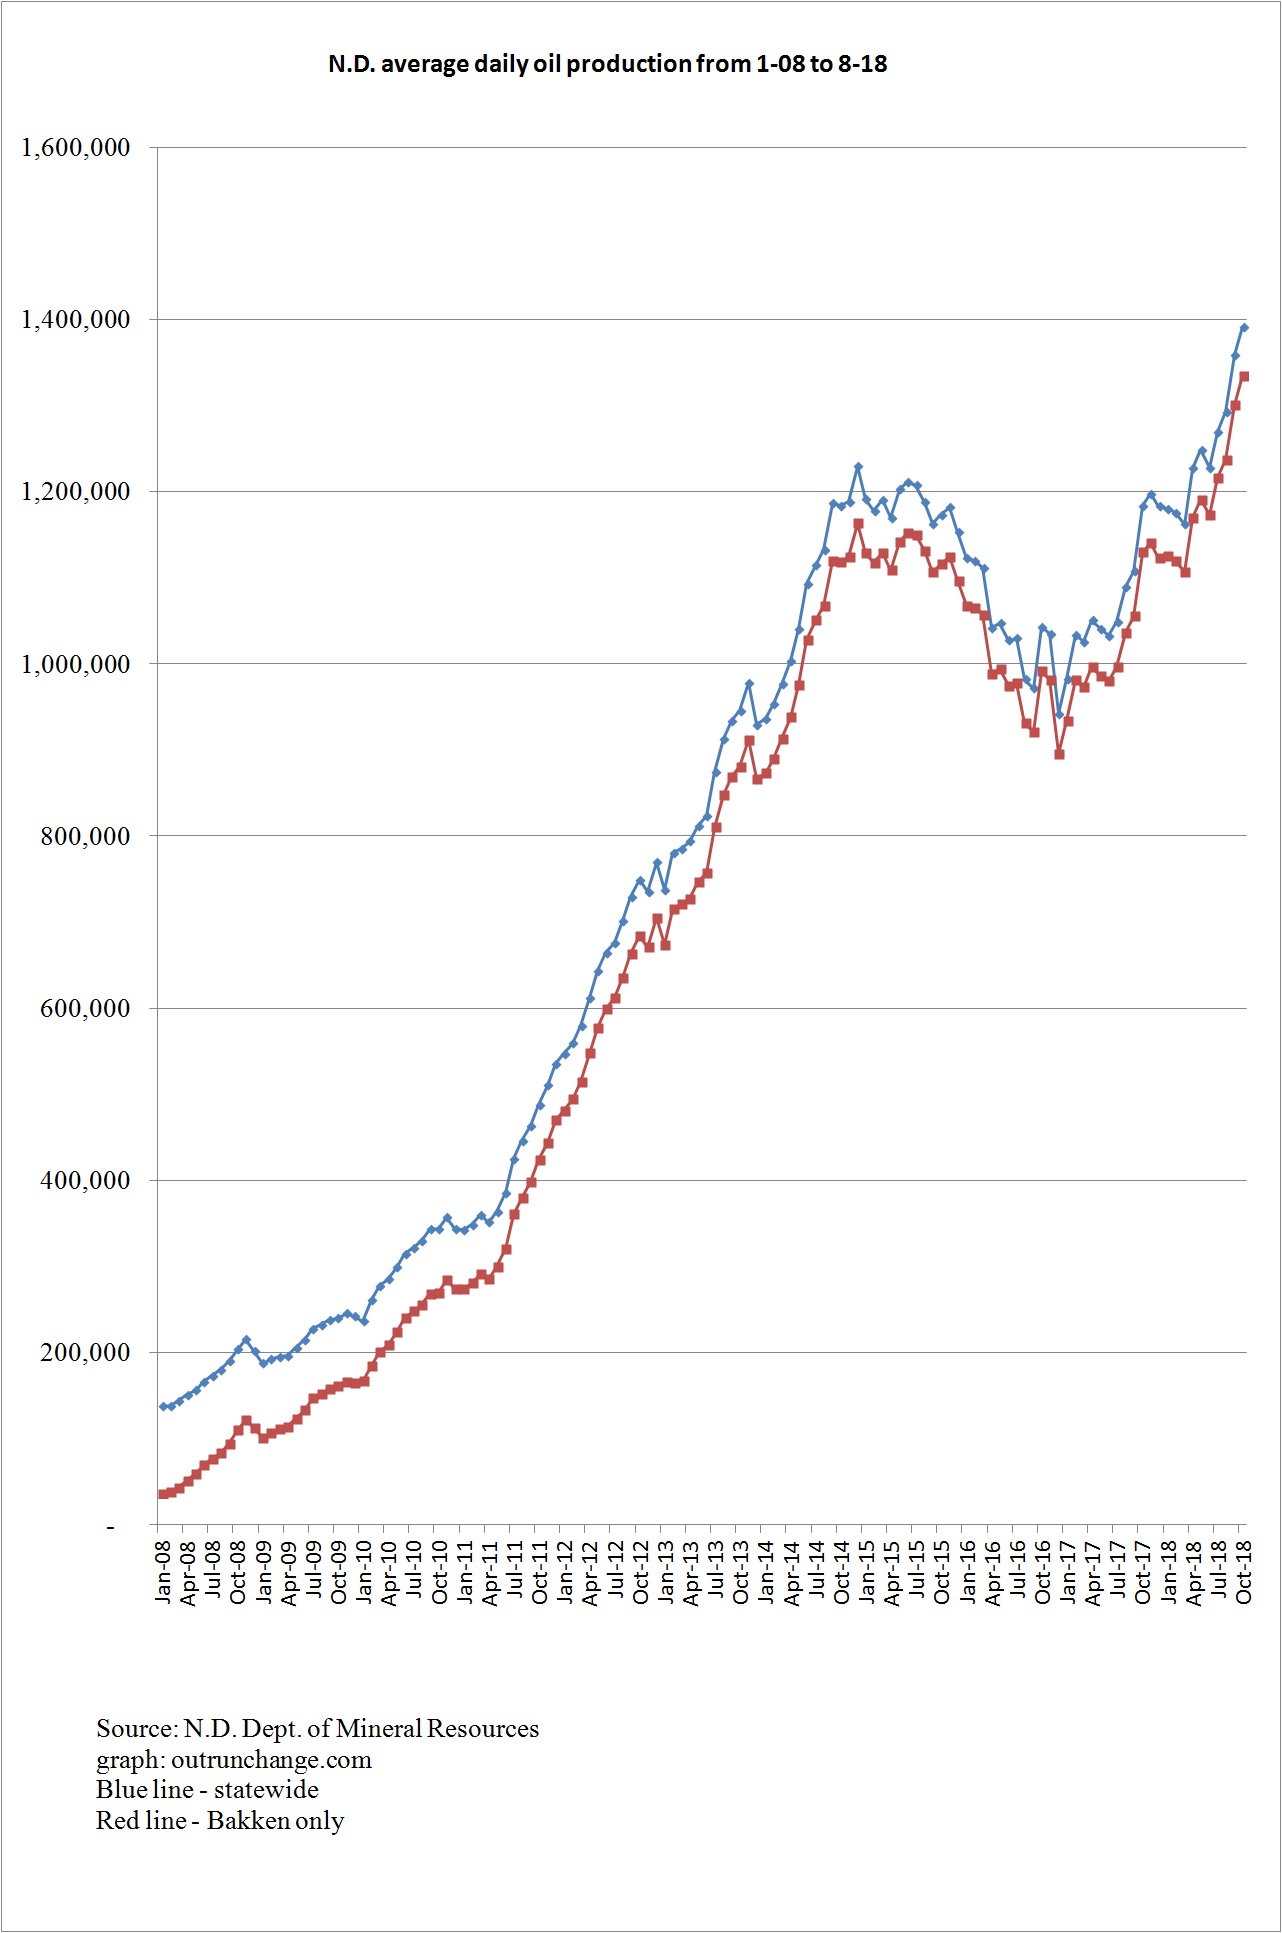
Statewide and Bakken shale production has been trending up sharply.  Last winter’s lull is quite visible. The output curve is starting to take on the rapid growth angle visible back in 2012 and 2013.


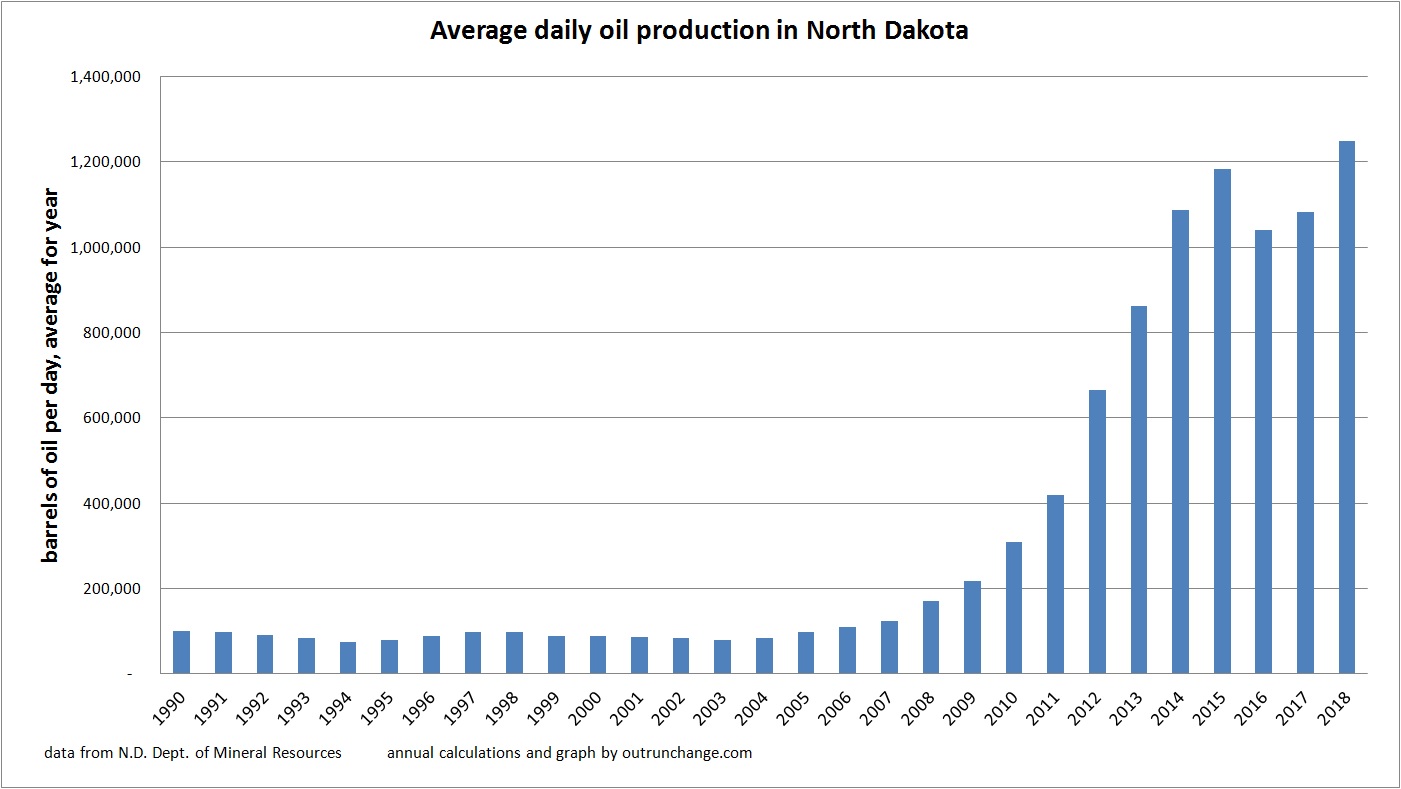
For a longer term perspective, check out the average daily production since 1990:

Continue reading “North Dakota oil production hits another record in September 2018 and again in October”

Oil production in August 2018 for North Dakota hits another record level

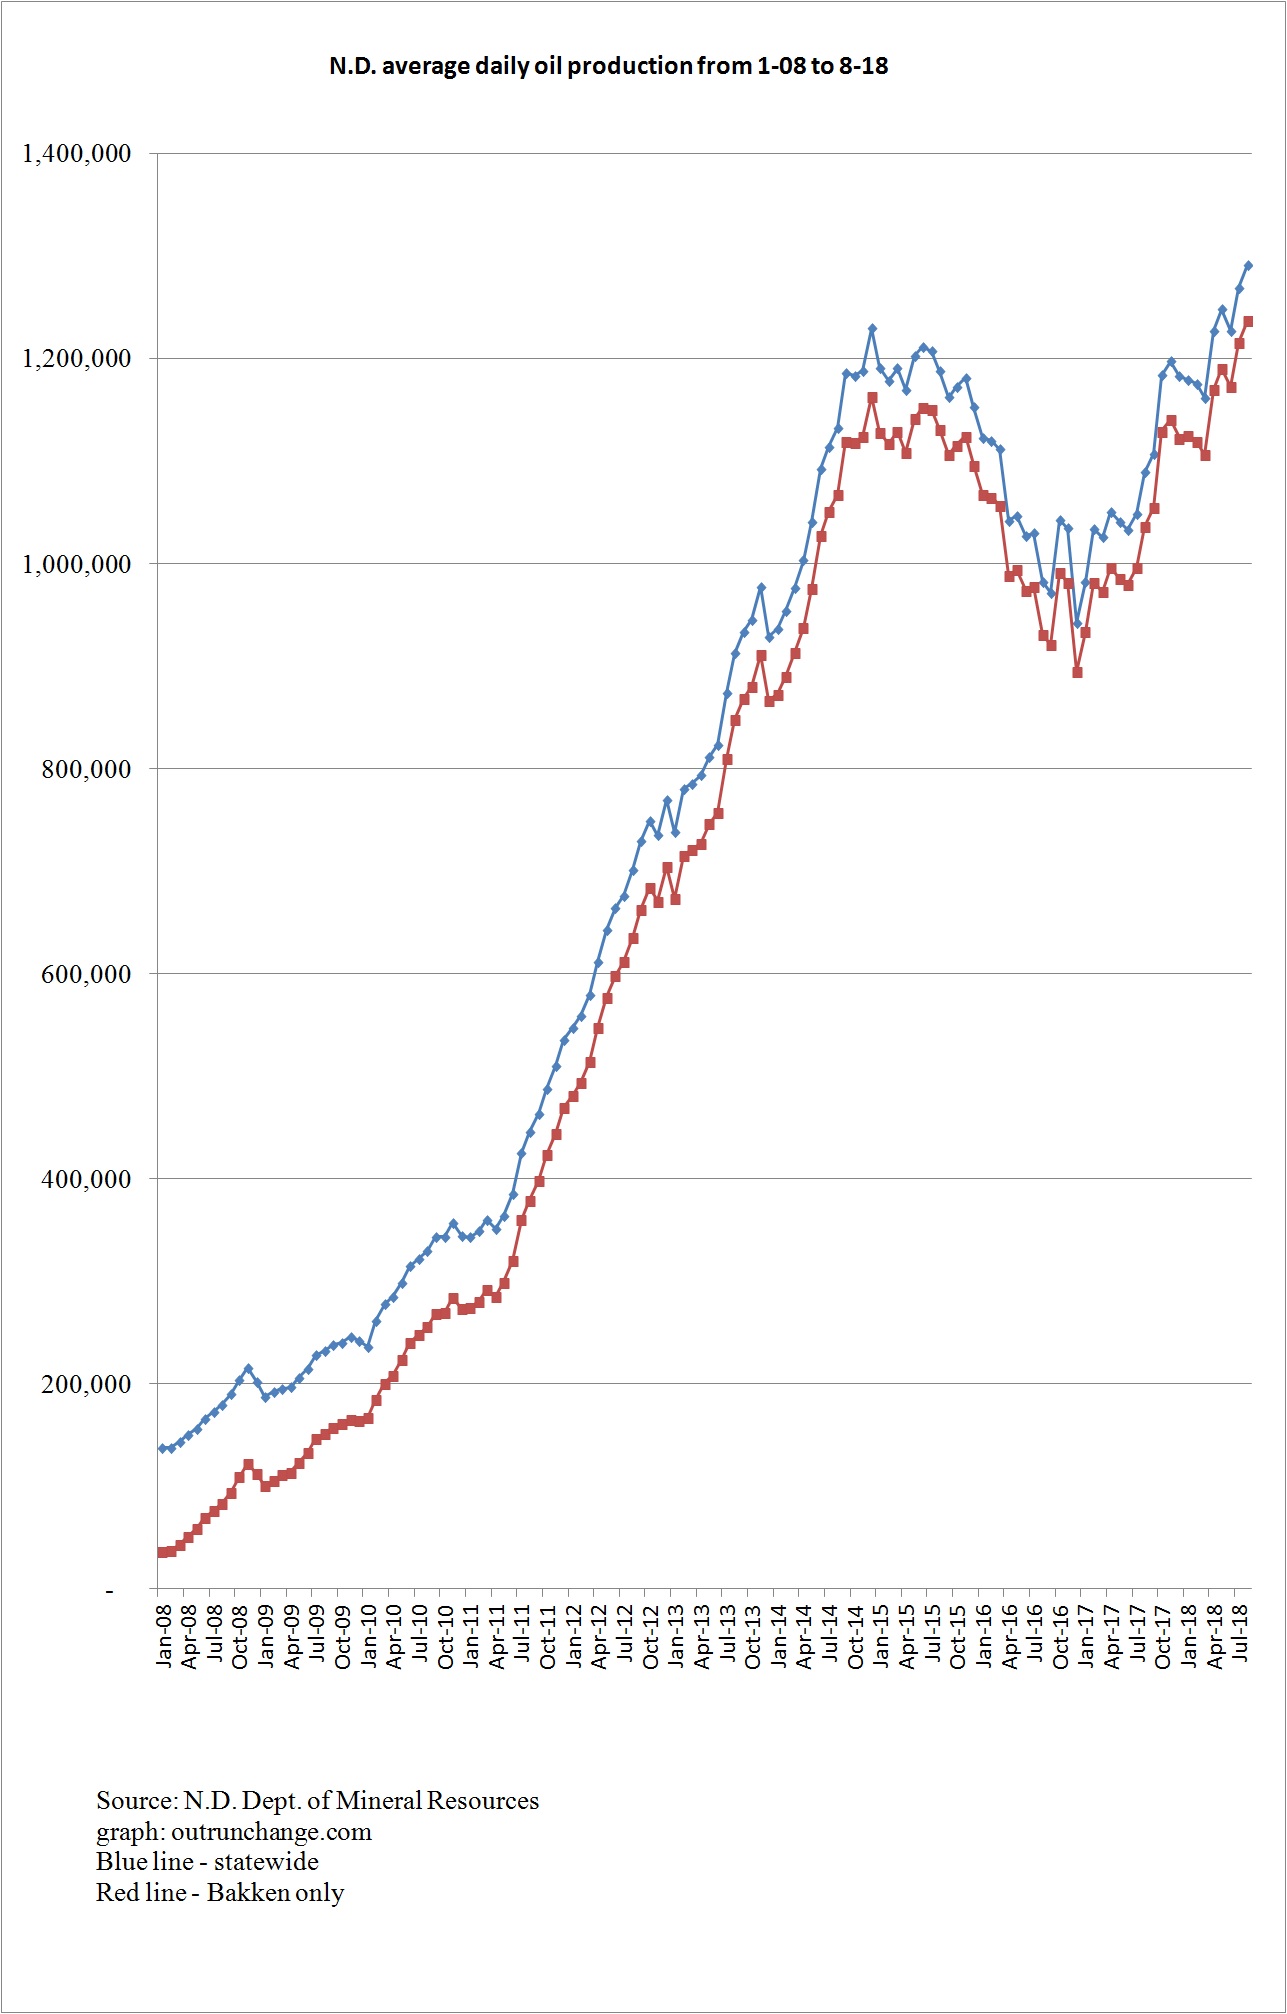
In August the crude oil production in the state hit an average of 1,291,496 barrels of oil per day (bopd). As always, that is the preliminary tally, which will change when a few late reports arrive.

The record high before a several year slump was an average 1,229,572 bopd in December 2014.

In the last five months there have been three record highs with two months barely under the 12/14 record.

Here is my graph of production state-wide and Bakken only (including Sanish, Three Forks, and Bakken/Three Forks levels). Notice the steady increase over the last few months and a strong rise since winter of ‘16/’17.


For a far longer perspective, look at the average production data since 1990.  I like this graph because it shows a pattern of explosive growth from about 2008 through late-2014, a drop until around the end of 2017 and a rapid growth since then. The longer view:

Continue reading “Oil production in August 2018 for North Dakota hits another record level”

Volume and value of 2017 oil production in North Dakota

Notice all the empty space on that pad? Notice the disproportionately high number of storage tanks for the number of pumpjacks on site? One day there will be a lot more wells in operation. Photo by James Ulvog.

Before showing the average daily production, annual production, and value of that production, just a note on December 2017 production.

Average daily production dropped from 1,196,976 bopd (revised) in November to 1,181,319 bopd (preliminary) in December, a decline of 15,657 bopd, or 1.31%.

Here is what the average daily production by year looks like. Notice the recovery in 2017?

Continue reading “Volume and value of 2017 oil production in North Dakota”

Crude production during October 2017 in North Dakota rises 7%, to 1.18 million barrels a day

The big increase of 78,154 bopd to 1,185,499 bopd follows 4 months of over 1.5% increase each month. That is a 14.8% runup in fourth months.

The record high production was 1,211,330 bopd in June 2015. There have only been four months when the average daily production was higher than in October 2017.

Another 27K bopd increase would put the state at a new record for production. With November and December production stats to go before the weather turns really nasty, that level of increase is likely. (Notice how lame that prediction is? A forecast two months out that is a mere 2% increase, when 8 of the 13 months have seen greater than 1.5% increase and 5 months saw a decline.) For perspective, at mid-December the couple of snow falls received so far haven’t outlasted the sunshine.

In my next post I will scratch my head wondering why the production jumped so much in one month.

Here is the monthly production, with a breakout of oil from the Bakken formation (which also includes the Sanish, Three Forks, and Bakken/Three Forks Pools formations):
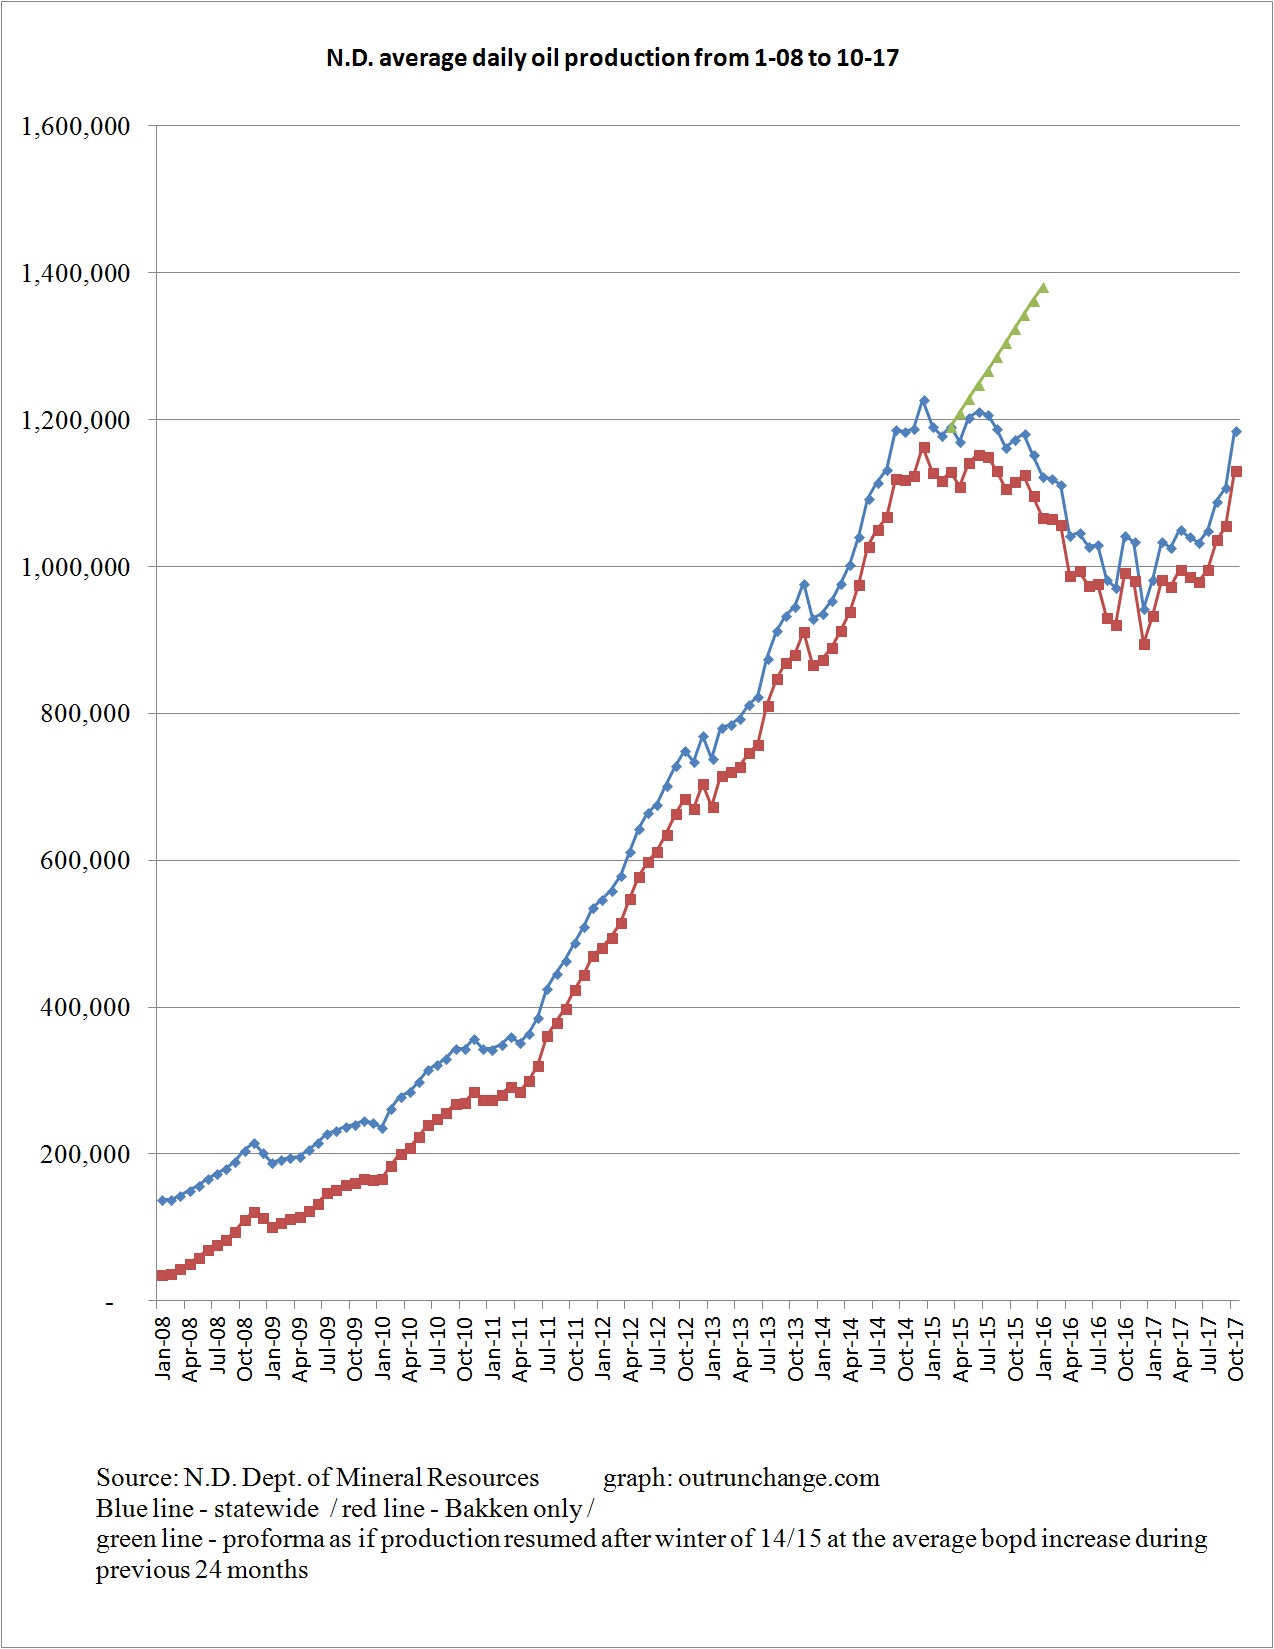
 

For a longer term perspective, here is the total production in the state since 1990:

Continue reading “Crude production during October 2017 in North Dakota rises 7%, to 1.18 million barrels a day”
Crude production in North Dakota rises to 1.08 million barrels a day in August 2017

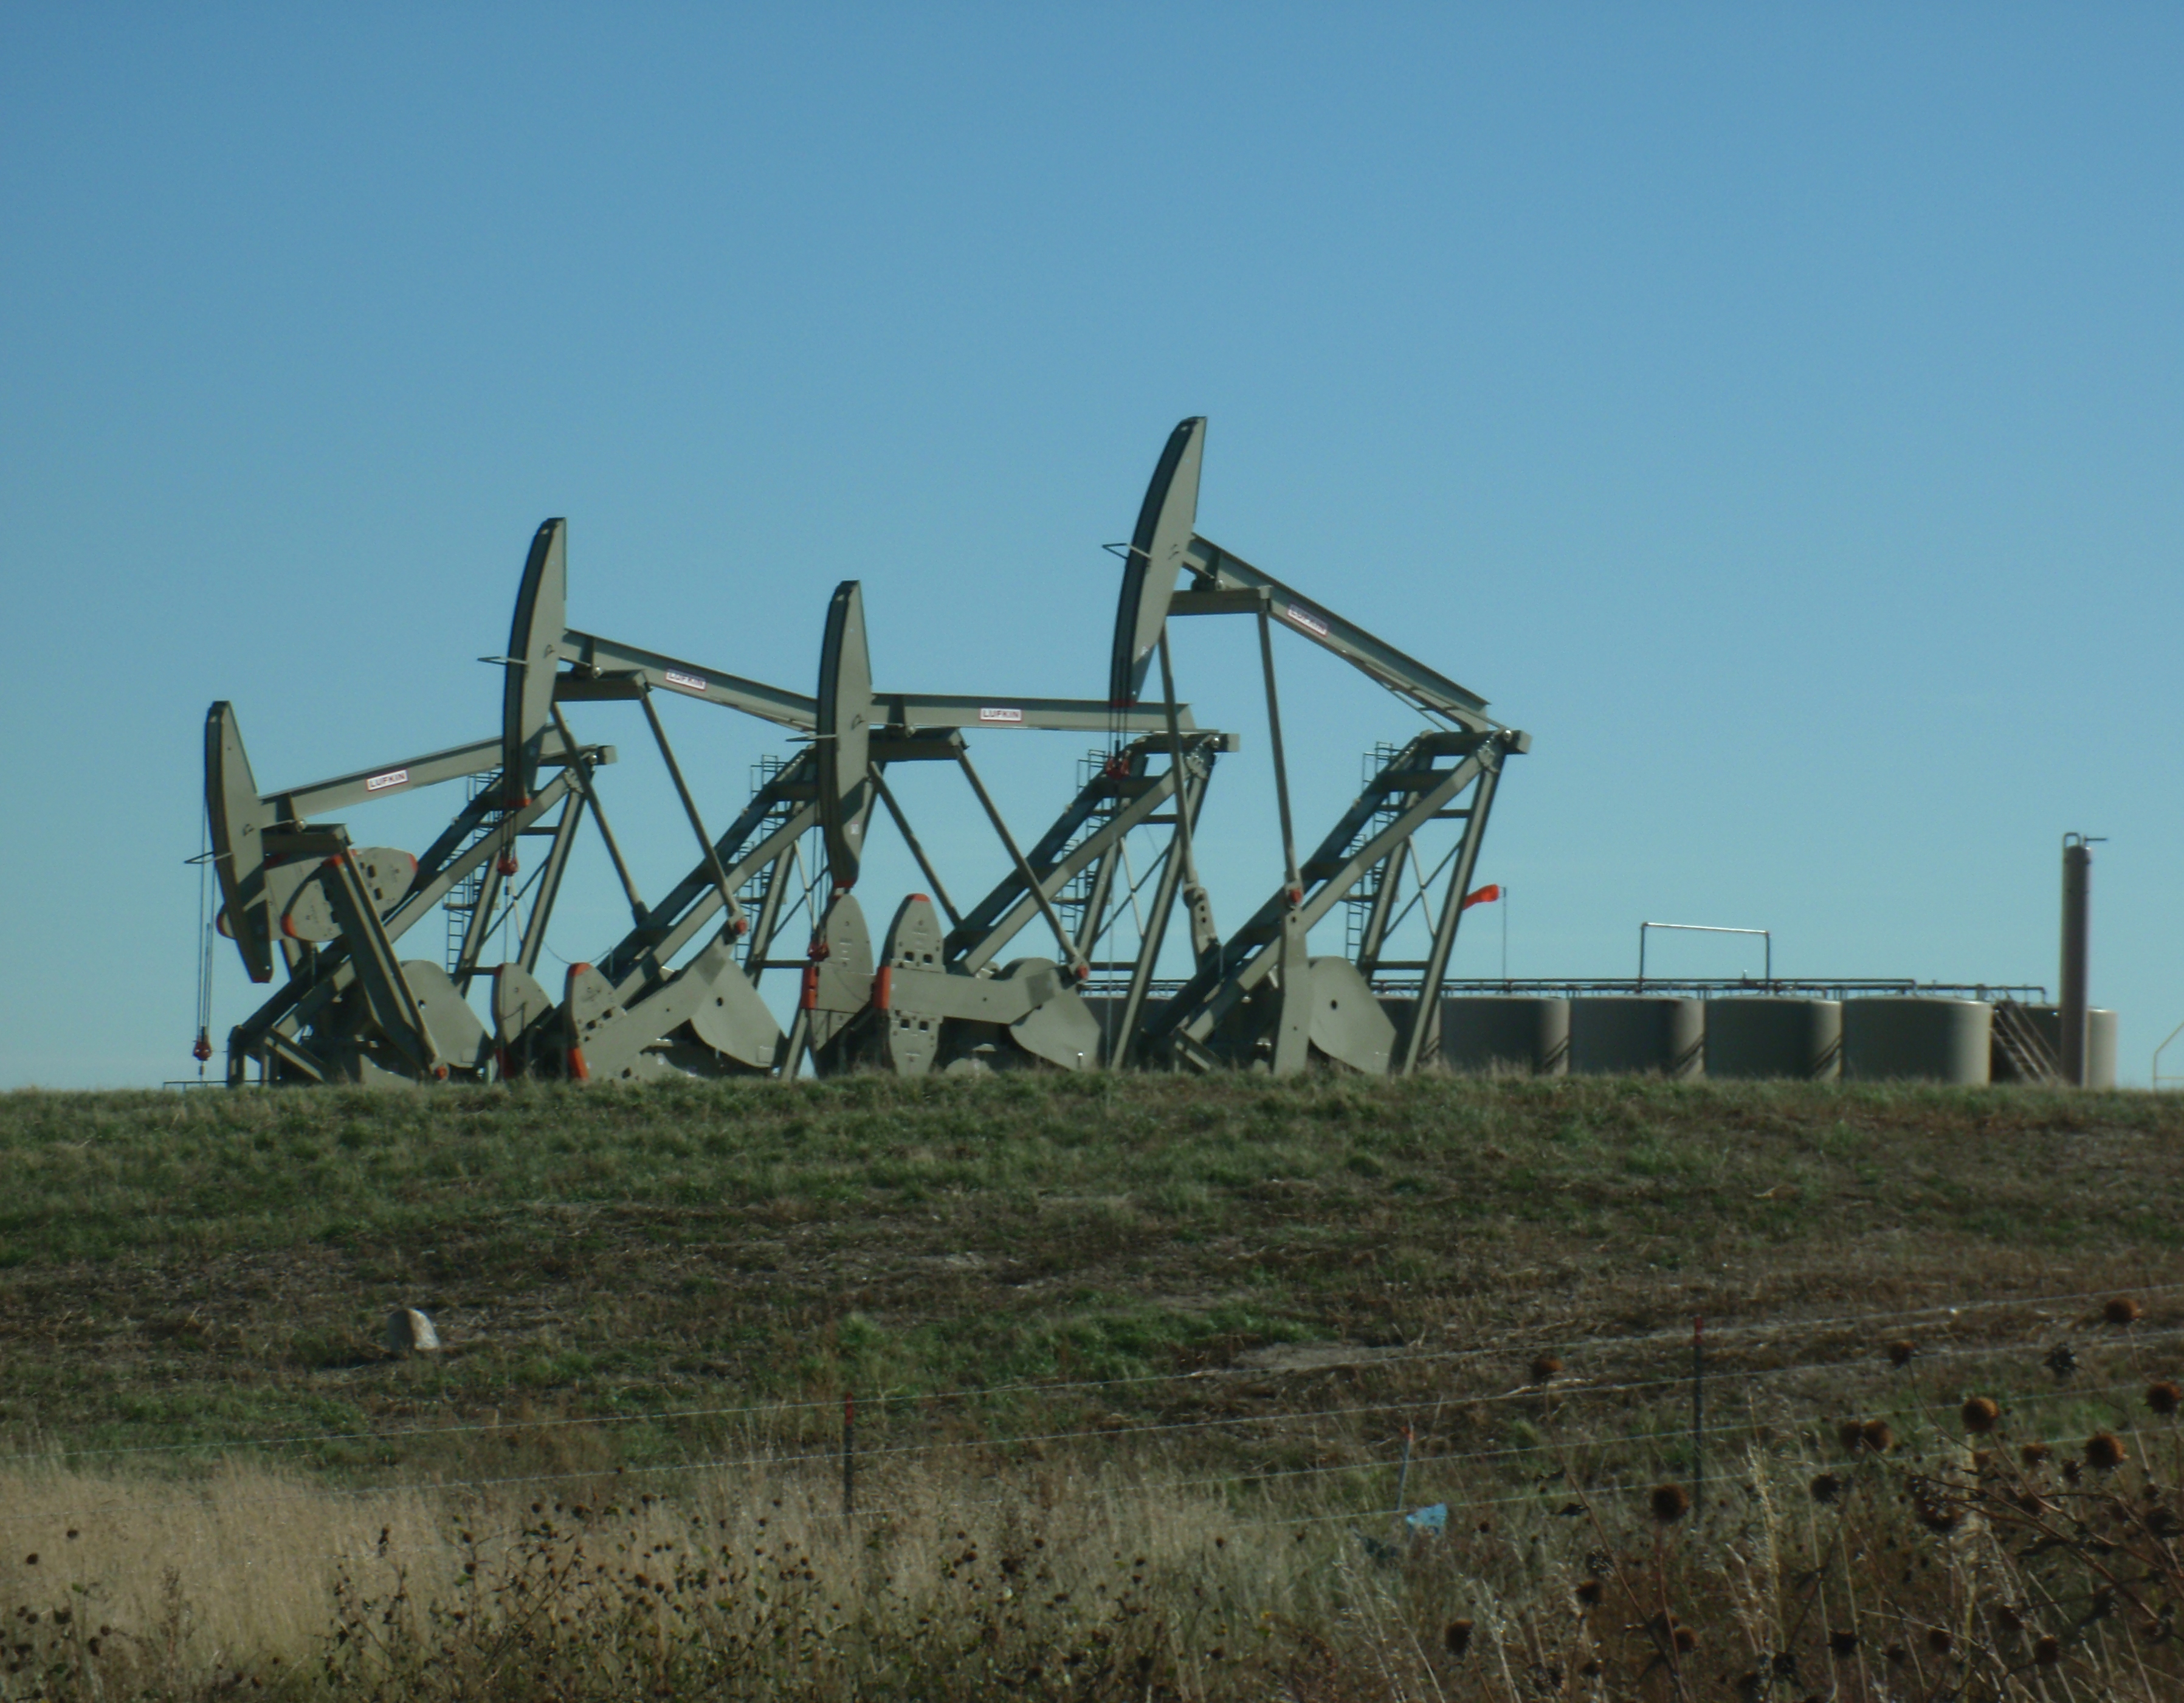
Based on the number of storage tanks on that pad, I’ll guess there will be a lot more than 2 wells operating on that site in a few years. Photo by James Ulvog.

Production of crude oil in the state rose to 1,085,690 bopd in August, an increase of 36,591 bopd from the updated production of 1,048,099 bopd in July. That is a 3.49% increase.

For context, that is the highest daily production since March 2016. On the front end of the boom, production did not rise to that level until June 2014.

The Williston Herald reports comments from Mr. Helms: Rigs moving away from Bakken’s core, but gas production still hits new high. Rigs are being deployed outside the core area of Bakken, away from the best sweet spots. I’m not sure what that means, but will guess it is an indication that drillers are more confident that prices will stay roughly where they are now or better.

Here is a graph of crude produced in the state and from the Bakken formation (along with Three Forks):

Continue reading “Crude production in North Dakota rises to 1.08 million barrels a day in August 2017”

Energy update

Five more reasons Saudi Arabia is in a jam and American pipelines are overfull. There will be many more reasons on that site before all the drilling is done. Oh, check out that gorgeous sky. Photo by James Ulvog.

A few articles that caught my interest over the last months on energy issues:

  • Another new field with one and half or two billion barrels of oil that not even the energy wizards were sure was there – Oh yeah, what Peak Oil?
  • Saudi Arabia cracks down
  • Two billion a year is consumed for lifestyle support stipends paid to every descendant of the house of Saud
  • Pipeline capacity is constraint for otherwise expanding shale production
  • US hit crude export level of 1 million barrels a day this past summer

What Peak Oil?

7/12/17 – Houston Chronicle – Houston’s Talos Energy makes ‘significant’ find in Mexico’s waters – Two years ago the Mexican government allowed private companies to start exploring for oil in the country. The improved freedom for private companies to do what private companies do is paying off.

On 7/12 Talos Energy announced the “Zama-1” exploratory well has confirmed a new find which is estimated to hold between 1.4 billion and 2.0 billion barrels of oil-in-place.

Oil that can now be pulled from under the ocean to provide energy to a fuel-hungry world.

Continue reading “Energy update”

Background on the power struggle inside Saudi Arabia and why things won’t be getting better for OPEC anytime soon.

Oil refinery in Utah. Off-angle photo by James Ulvog.

It took a short while, but more info emerged on the power transition inside Saudi Arabia. When there are no elections and dissent is not allowed in a country, armed and coercive backroom power plays determine who is in power.

Also, the distress on OPEC+Russia isn’t likely to end soon.

7/2/17 – Wall Street Journal – Saudi Arabia Moves to Silence Deposed Prince, Dissidents – Article says the newly appointed Crown Prince, Mohammed bin Salman, has placed travel restrictions on the former Crown Prince.

More serious is that the former Crown Prince’s personal guards have been replaced with other guards loyal to the royal court. From my reading of court intrigue from ancient history, which I think carries over to a modern autocratic country, a leader recruits guards whose primary loyalty is to that leader. Replacing a leader’s guards represents a significant degradation in the power and especially the ability to someone to intervene politically. It also is a serious drop in the level of personal security.

Continue reading “Background on the power struggle inside Saudi Arabia and why things won’t be getting better for OPEC anytime soon.”

The massive economic and environmental impact of fracking.

Wells being drilled by that rig have long since gone into operation and contributed their share to increased US production.

The impact of fracking is massive. Large increases in production of natural gas and crude oil has created a long list of favorable economic and environment impacts.

7/6/17 – Victor Davis Hanson at National Review – The Fracking Industry Deserves Our Gratitude – Prof. Hanson provides a fast survey of how much fracking has improved the American economy. Fracking is the combination of horizontal drilling with hydraulic fracturing.

The impact of fracking is staggering.

Ten years ago eeeeeeverybody knew for an absolute certainty that Peak Oil was here and we were about to run out of oil. The Secretary of Energy was wishfully musing that gasoline would rise from $4 to $10 a gallon.

In the last five years, gasoline prices are down about $1.50 a gallon, surge in natural gas production displaced coal consumption which has reduced our CO2 output by 12% in the last decade (surpassing the EU in cuts), and reduced our oil imports by five million barrels a day.

Let me rephrase that part about CO2…

Continue reading “The massive economic and environmental impact of fracking.”

More graphs of North Dakota oil production in April 2017

Yesterday’s post described the 2.4% increase in North Dakota oil production. Here are a few more graphs to tell the story.

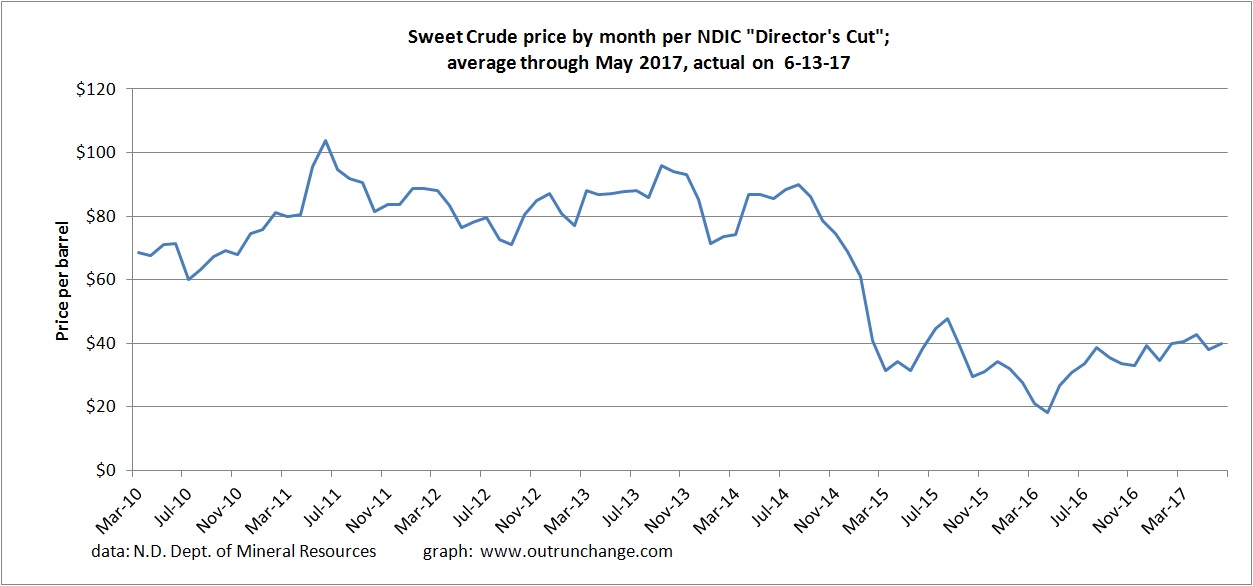
Here is the average sweet crude price in the state by month:


Continue reading “More graphs of North Dakota oil production in April 2017”