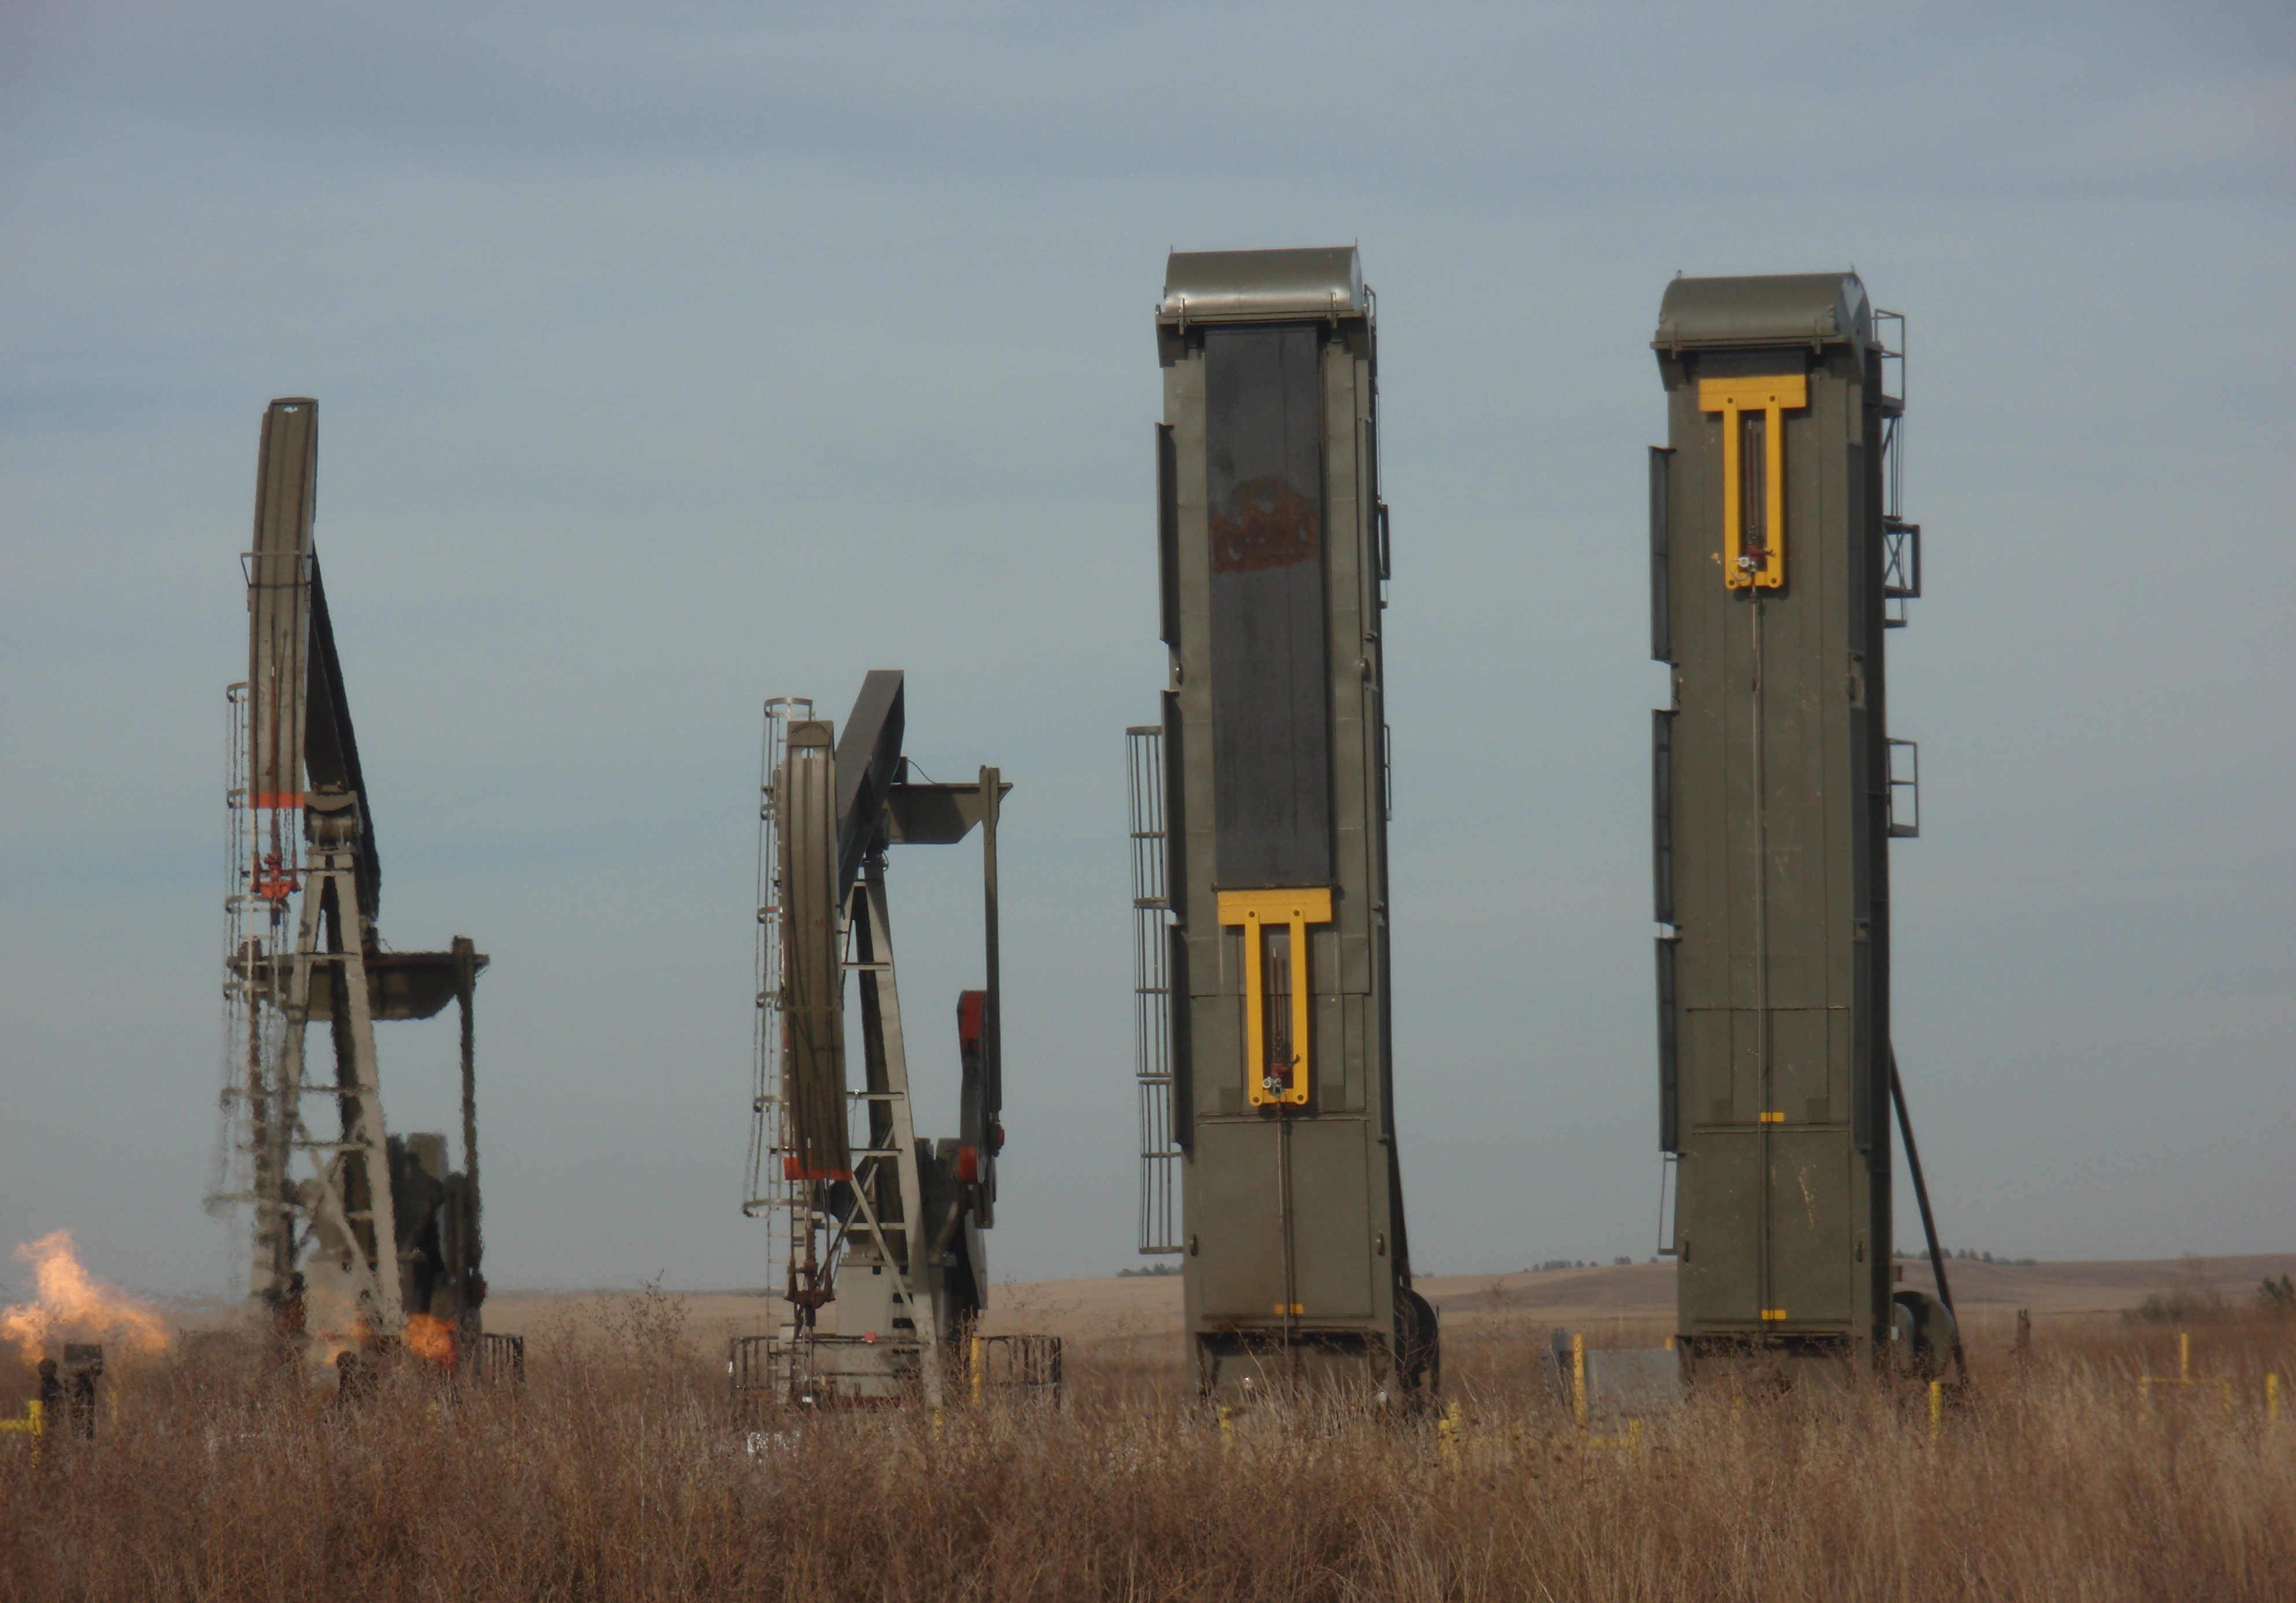
Prof. Mark Perry pulled together some estimates on the economics of a Bakken well in North Dakota in his post Top ten things I learned on my summer trip to the Bakken oil fields, Part II. Previously discussed Part I and Part II.
Here was his data:
Average cost to drill, frack and complete a Bakken oil well: $9 million
Expected production life of a Bakken oil well: 45 years
Lifetime oil production per well: 615,000 barrels
Expected lifetime revenue generated per well: $46.125 million at $75 per barrel
Total operating expenses per well: $2.3 million
Royalty payments to mineral owners per well over 45 years: $7.3 million
Taxes Paid per well: $4.325 million total ($2.1 million gross production taxes, $1.8 million extraction tax and $425,000 in sales taxes)
Total employee salaries and wages per well: $2.125 million
Average Profits Generated per Bakken well: $20 million net of costs and taxes
Let me rework those numbers –
This is a really rough guess of what the lifetime income statement might look like for one well:
| revenue | 46.13 |
| . | |
| drill frack complete | 9.00 |
| operating expenses | 2.30 |
| royalties | 7.30 |
| taxes to gov’n | 4.33 |
| salaries & wages | 2.13 |
| —- | |
| total costs | 25.05 |
| margin | 21.08 |
Now lets spread that out. All the drilling costs are paid before one barrel is sold. There is a fast depletion of a well. Let’s assume 50% of the oil is drawn in the first year, 25% in the second, and all the rest is spread over the next 3 or 4 decades. Let’s also assume that the variable costs correlate to the production. That weights the costs a bit to the front end.
This is what the income statement by year looks like:
| drill | yr 1 | yr 2 | decades | |
| revenue | 23.06 | 11.53 | 11.53 | |
| . | ||||
| drill frack complete | 9.00 | |||
| operating expenses | 1.15 | 0.58 | 0.58 | |
| royalties | 3.65 | 1.83 | 1.83 | |
| taxes to gov’n | 2.16 | 1.08 | 1.08 | |
| salaries & wages | 1.06 | 0.53 | 0.53 | |
| —- | —- | —- | —- | |
| total costs | 9.00 | 8.02 | 4.02 | 4.02 |
| margin | (9.00) | 15.04 | 7.51 | 7.51 |
That produces an incredible internal rate of return (IRR). The costs are recovered in the first year. It’s gravy from there on.
Let’s push the revenue and costs out a bit to dial back the IRR. The following assumes 40% in the first year, 20% in the second, and the rest spread over decades.
| drill | yr 1 | yr 2 | decades | |
| revenue | 18.45 | 9.23 | 18.45 | |
| . | ||||
| drill frack complete | 9.00 | |||
| operating expenses | 0.92 | 0.46 | 0.92 | |
| royalties | 2.92 | 1.46 | 2.92 | |
| taxes to gov’n | 1.73 | 0.87 | 1.73 | |
| salaries & wages | 0.85 | 0.43 | 0.85 | |
| —- | —- | —- | —- | |
| total costs | 9.00 | 6.42 | 3.22 | 6.42 |
| margin | (9.00) | 12.03 | 6.01 | 12.03 |
Still an astounding IRR. There are lots of CFOs in a huge number of companies that would love to get IRRs like that.
As I realized from Bruce Oksol, that huge IRR is heavily dependent on oil prices in the next 12 months. Therefore it makes sense to store oil in the ground until prices recover.
In relation to tradition oil fields, when looking at Bakken wells with a two or three year time horizon that does sort of make tight oil look something like an on-and-off play, doesn’t it?
What do you think? Did I miss something in my simple calculations? Any ideas on how to refine the numbers?