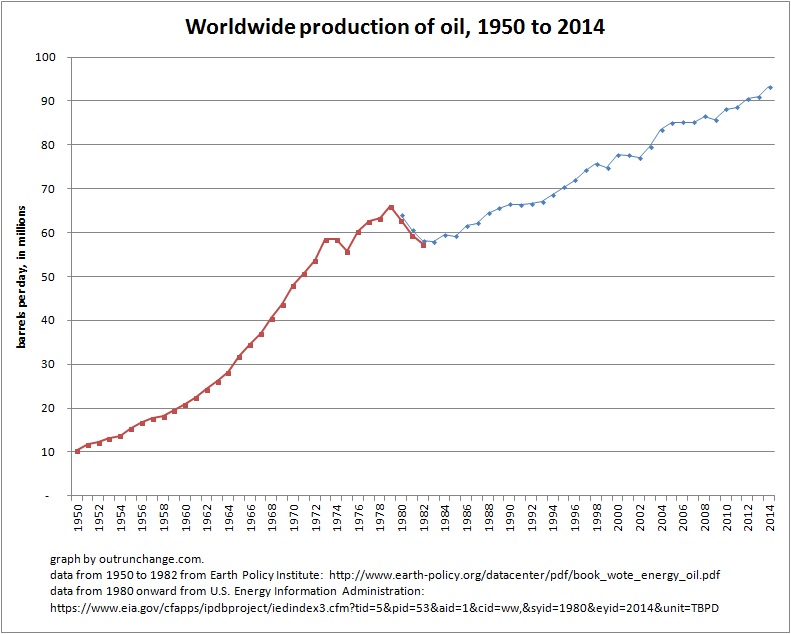
An article explaining why Peak Oilers are in hiding prompted me to graph worldwide oil production.
Peak Oil doctrine was wrong when announced by Dr. Hubbert. It was wrong at the turn of the century before the energy revolution was kicked off by technology that was unimaginable 50 years ago. Peak Oil doctrine is still wrong. It will continue to be wrong.
Check out my graph to see a visual explanation of the foolishness.
1/21 – Hit and Run blog at Reason – Where Have All the Peak Oilers Gone? – Article points out that four of the most visible Peak Oilers are in hiding. Another one of them is still speaking out. In addition, he wrote a new forward in 2010 to his 2007 book proclaiming yet again oil production will go into an irreversible, inevitable slide.
Two data points that provide more proof of the foolishness of Peak Oil doctrine:
- 84M barrels a day – average global production in 2007
- 94M barrels a day – average global production at the end of 2015
Doesn’t quite look to me like an irreversible, inevitable, unavoidable decline to zero.
That post prompted me to see if I could graph the worldwide production.
Hmm. Yes, turns out I can prep such a graph.
Here it is:
Had to use two sets of data to develop the graph. I overlapped the data by three years to show the small amount of inconsistency between the two data sets. Several moments of search at the EIA site did not reveal where they have data before 1980 and I’m not going to spend more time searching their site.
Remember Peak Oil doctrine states that oil production would hit a peak in 1970 and then begin an irreversible, inevitable decline to near zero. Production should look like an inverted V. The decline should essentially mirror the runup to the peak.
Notice the trend from 1950 to 1970? The decline in production after 1970 should be a mirror reflection. Is that what you see after 1970?
Could someone far smarter than me please point out where the peak was?
Please, point out to me the reversal and drop toward zero?
Please, can someone explain why some year in the ’70s was not the high point of the graph?
What do you think?
Only professional comments will be approved. On the other hand, all professional comments will be approved.
