[youtube=https://www.youtube.com/watch?v=c9nnsAGyQ2k]
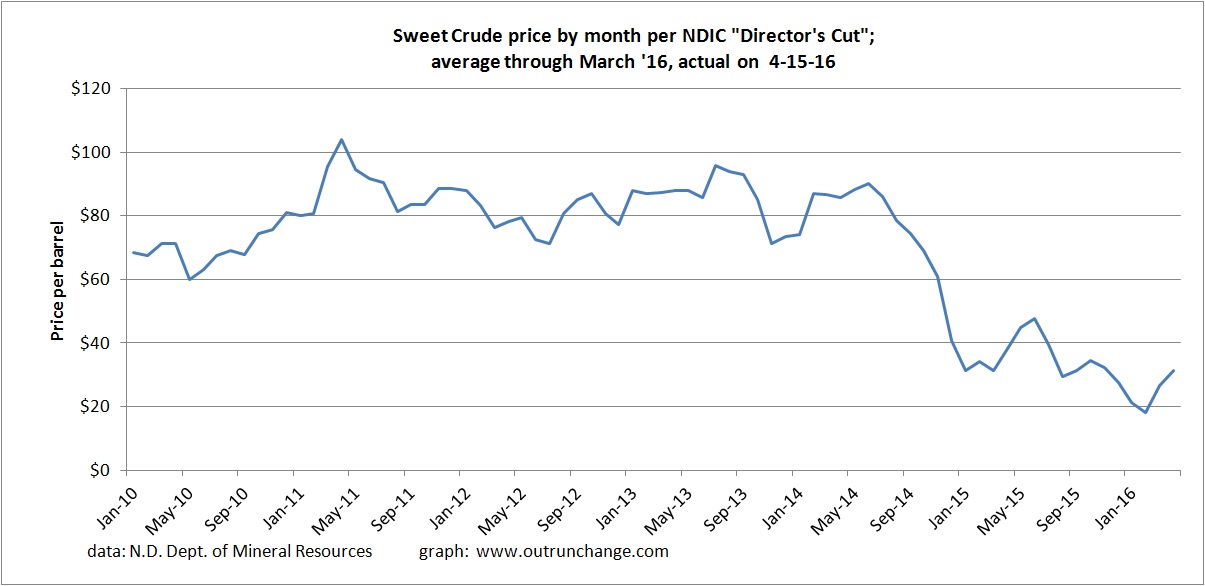
Rounding out the picture of North Dakota oil production based on data released by the state on April 15, 2016, here is a graph of the sweet crude prices in North Dakota from January 2010 through April 2016. Quite visible is the dramatic drop in late 2014. Of particular note is prices have recovered in the last two months.
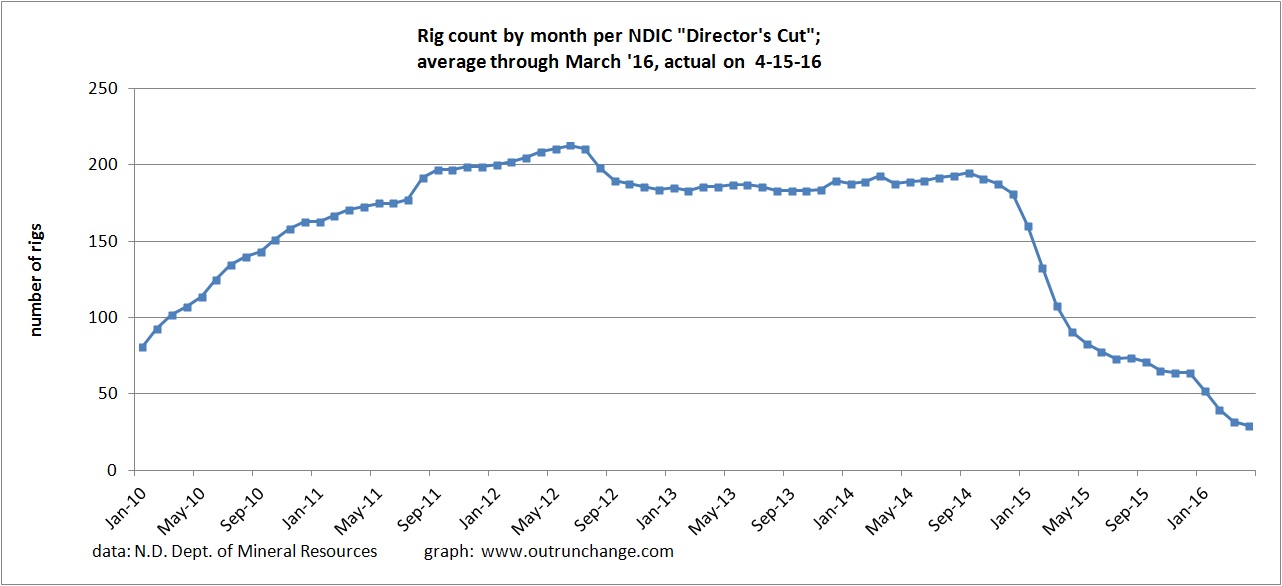
Next is a graph of the rig count by month. You can also see a dramatic drop starting the end of 2014.
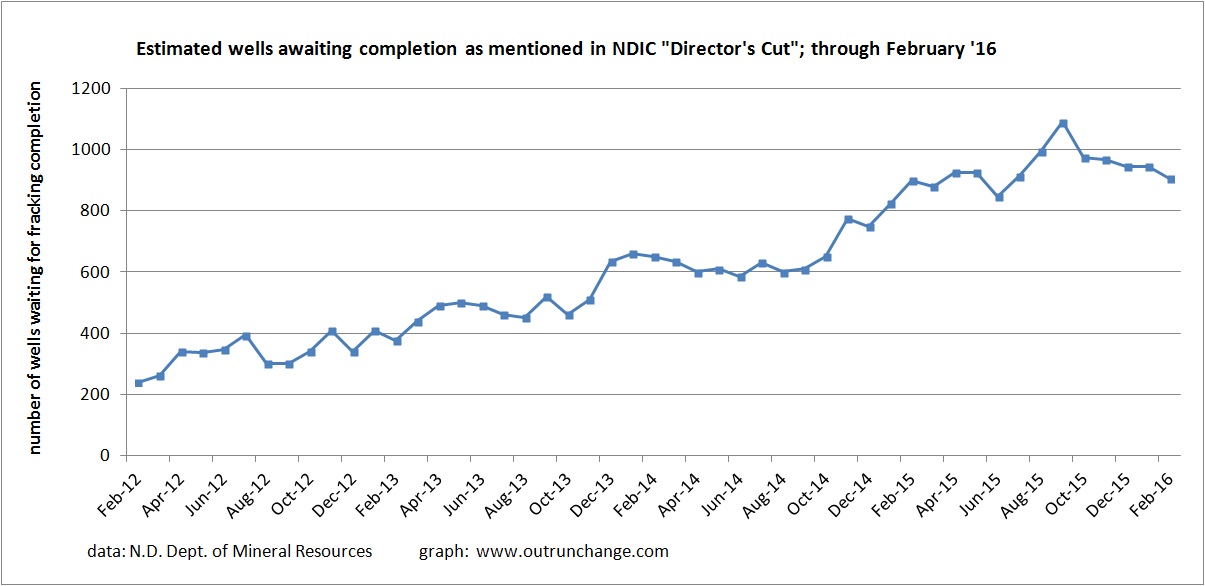
Finally is a graph of the fracklog from January 2012 through February 2016. This is the number of wells that have been drilled yet are uncompleted (DUC) meaning the well is drilled to total depth but the fracking has not yet been done. Basically this is a half million barrels of oil put on the inventory shelf until prices recover. That represents nearly a thousand wells than can be brought on-line rather quickly.


