[youtube=https://www.youtube.com/watch?v=3ZYVN_7PG_M]
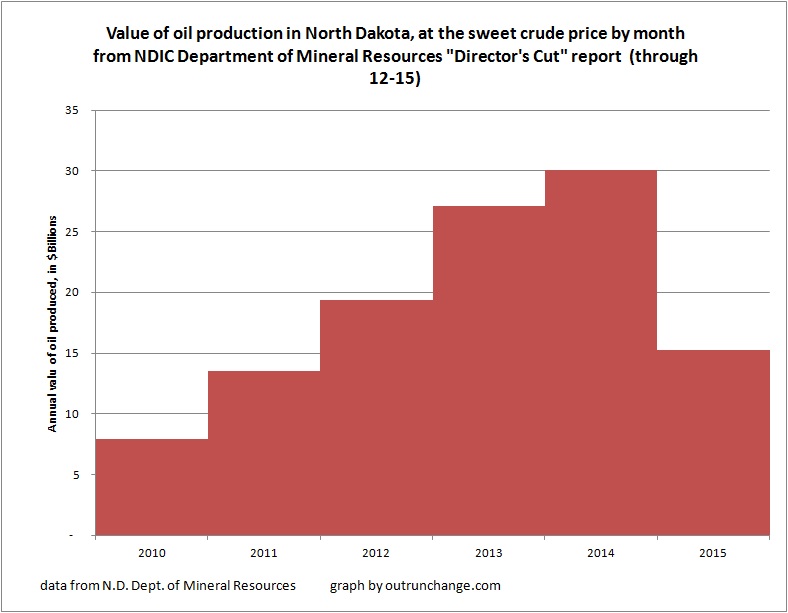
Some graphs to show the value of oil produced in North Dakota.
First, the value of production by year from 2010 through December 2015.
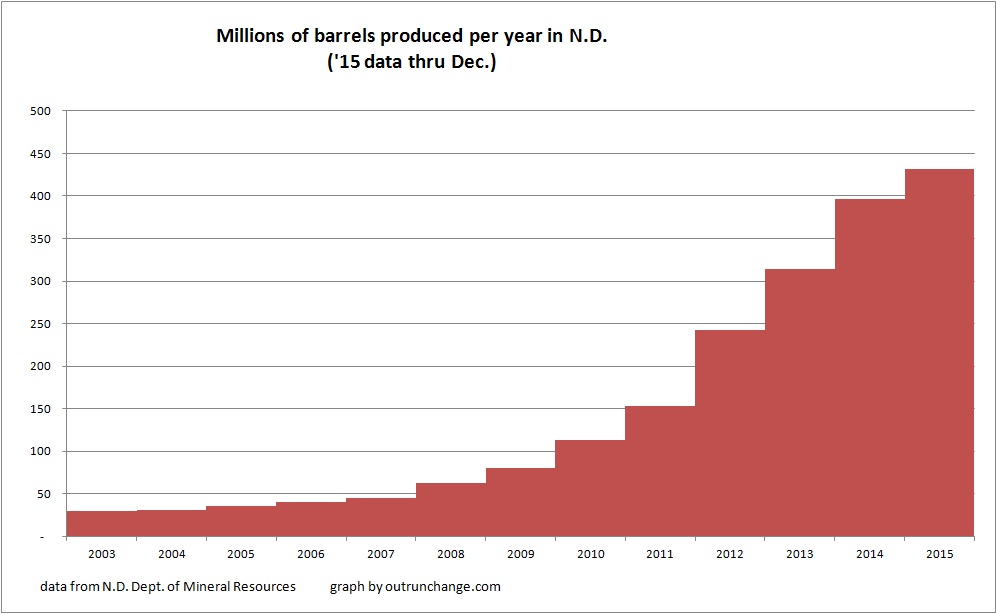
To show the impact of volume, next is a graph of the volume of production for the year from 2003 through 2015.
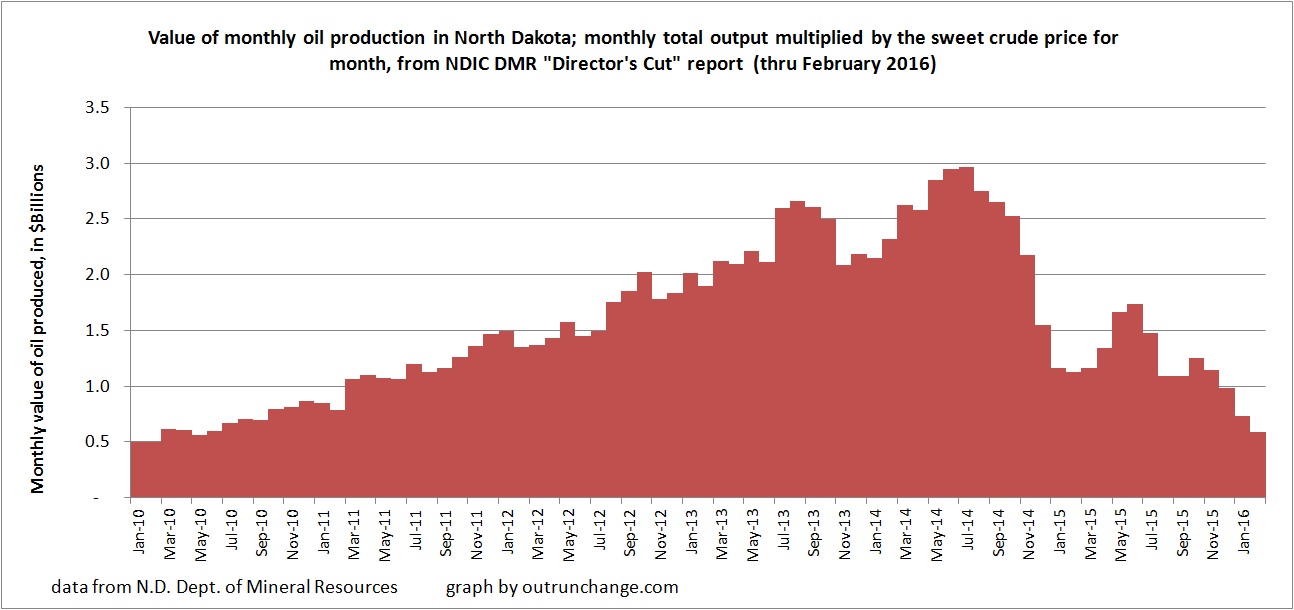
Finally, to see the impact of drop in prices is a graph of the value of monthly production from January 2010 through February 2016. Based on information through mid-April, February was the low point in oil prices. There has been an uptrend since then.


One thought on “Value of crude oil production in North Dakota over the years, through 2015”