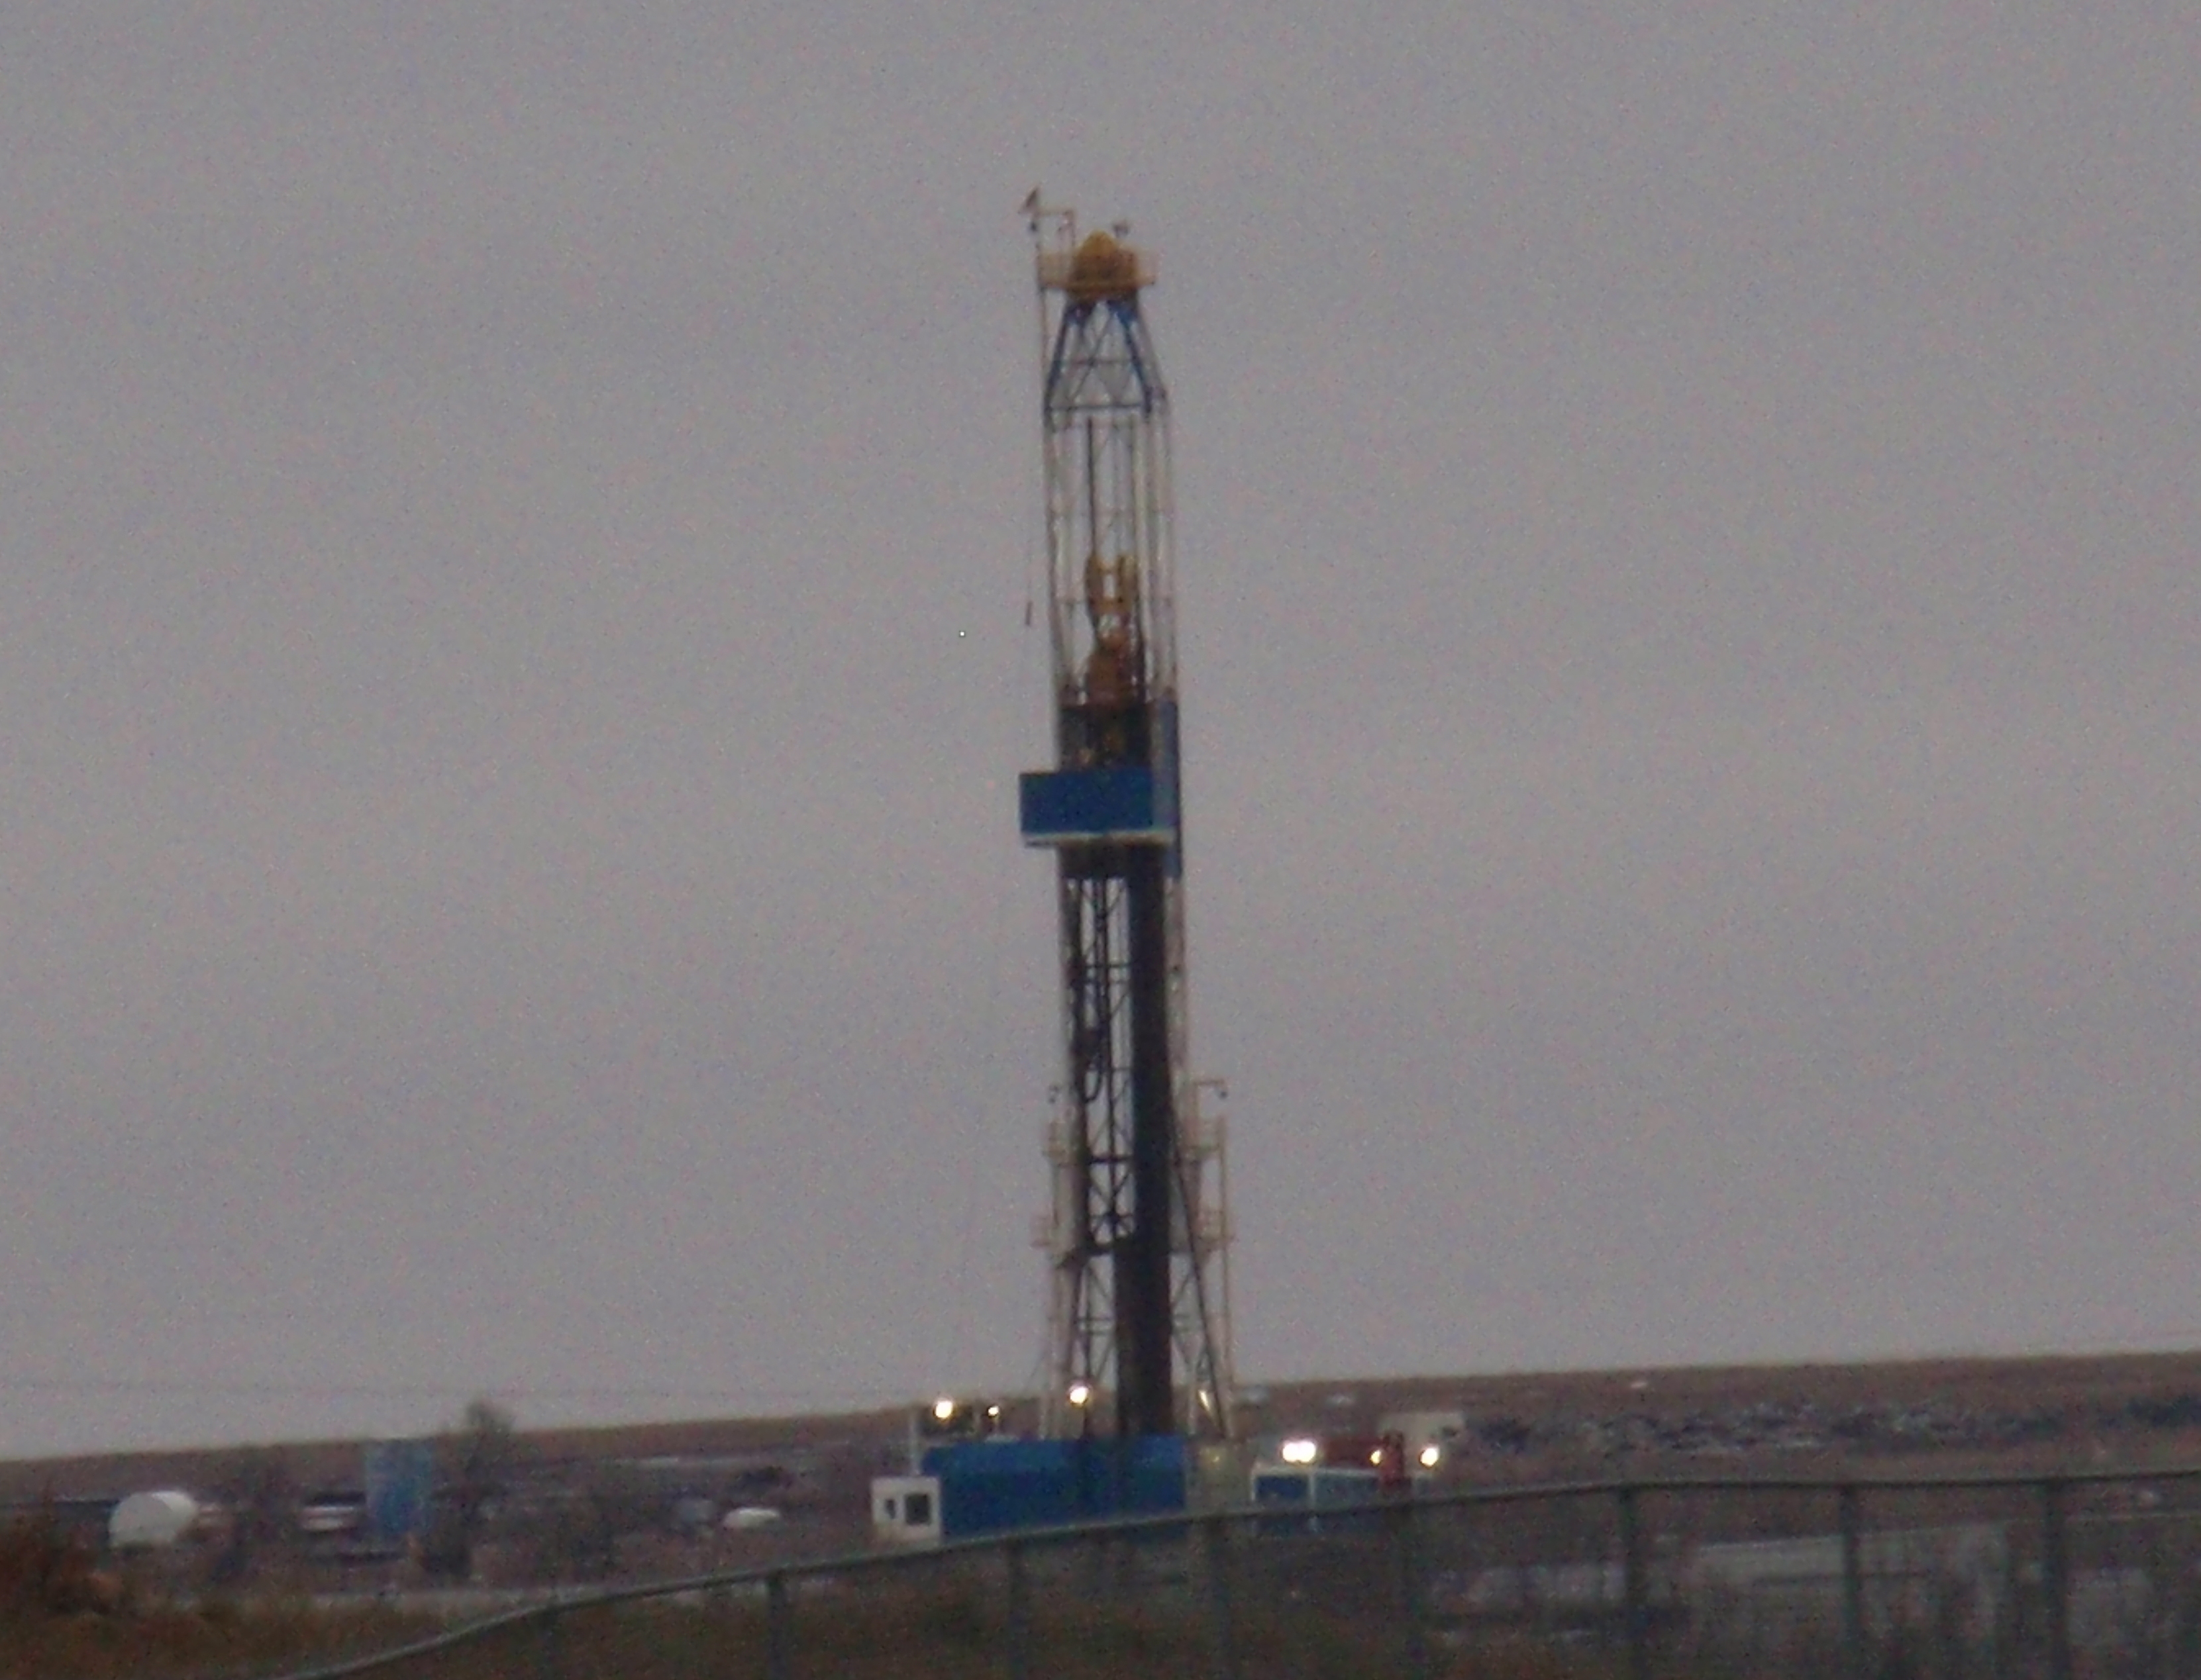
The count of drilling rigs in operation across the state has shown strong increase since fall ’16.
Here is a recap of the North Dakota rig count, all from Million Dollar Way. It has been a while since I posted an update.
Keep in mind that the dramatic increase in productivity and production per well means that the number of rigs isn’t anywhere near as important as it was several years ago. At the same time, the count of rigs is still one indicator of activity. Perhaps the long-term trends aren’t important while the shorter term trends are.
Keep in mind I gather data when I think to make notes on the count. Also, I haven’t double checked the numbers, so there very well could be some errors.
Here is some recent data I jotted down, along with some historical context:
- 183 – 12/31/12
- 184 – 2/4/13
- 191 – 11/29/13
- 187 – 12/31/13
- 190 – 2/4/14 (up 6)
- 183 – 11/29/14
- 170 – 12/31/14
- 140 – 2/4/15 (down 50)
- 64 – 11/29/15
- 61 – 12/31/15
- 38 – 2/25/16 (down 102)
- 25 – 4/26
- 27 – 6/22
- 35 – 7/28
- 31 – 8/26
- 33 – 9/30
- 38 – 11/22 – during my visit to Williston, from Williston Herald
- 37 – 11/25 – end of my visit to Williston, from the Herald
- 40 – 11/29 – baseline from day before OPEC agreement
- 39 – 11/30 – day of OPEC agreement
- 39 – 12/1
- 40 – 12/8
- 41 – 12/21
- 42 – 12/22 – not a huge change, but definitely an upward trend in the last few months
- 39 – 12/31/16
- 39 – 1/3/17
- 36 – 1/11 – looks like a drop, back to the levels of the summer and fall
- 38 – 1/20
- 38 – 1/30
- 40 – 1/31
- 36 – 2/9
- 40 – 2/19
- 42 – 2/22
- 44 – 2/23
- 40 – 3/1
- 44 – 3/10
- 46 – 3/16
- 47 – 3/20
- 48 – 3/23
- 49 – 3/24
- 50 – 3/31 – breach the 50 rig on the rising trend
- 49 – 4/4 – into 40s since mid-February