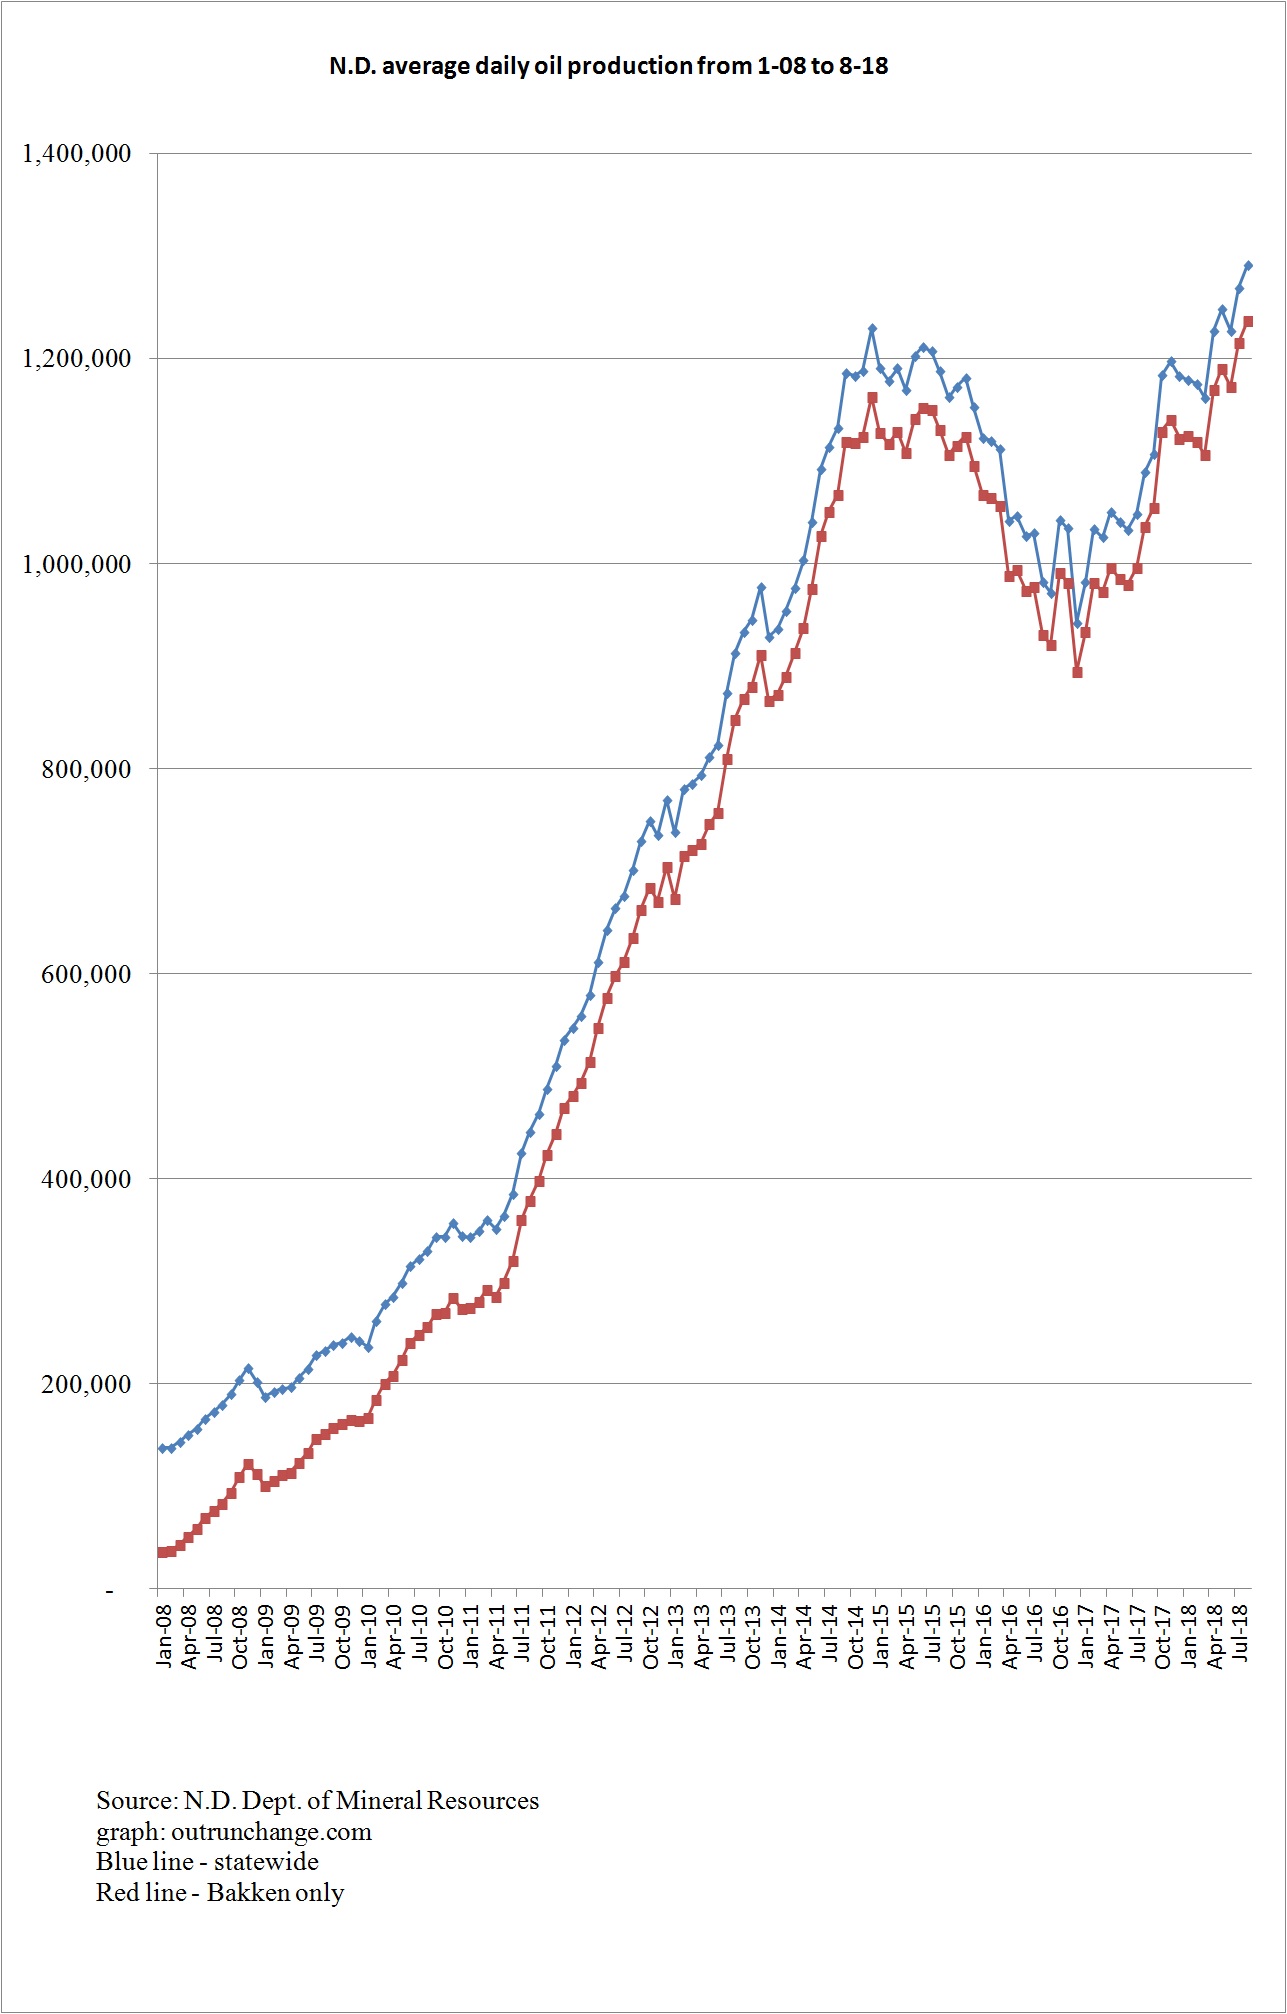
In August the crude oil production in the state hit an average of 1,291,496 barrels of oil per day (bopd). As always, that is the preliminary tally, which will change when a few late reports arrive.
The record high before a several year slump was an average 1,229,572 bopd in December 2014.
In the last five months there have been three record highs with two months barely under the 12/14 record.
Here is my graph of production state-wide and Bakken only (including Sanish, Three Forks, and Bakken/Three Forks levels). Notice the steady increase over the last few months and a strong rise since winter of ‘16/’17.
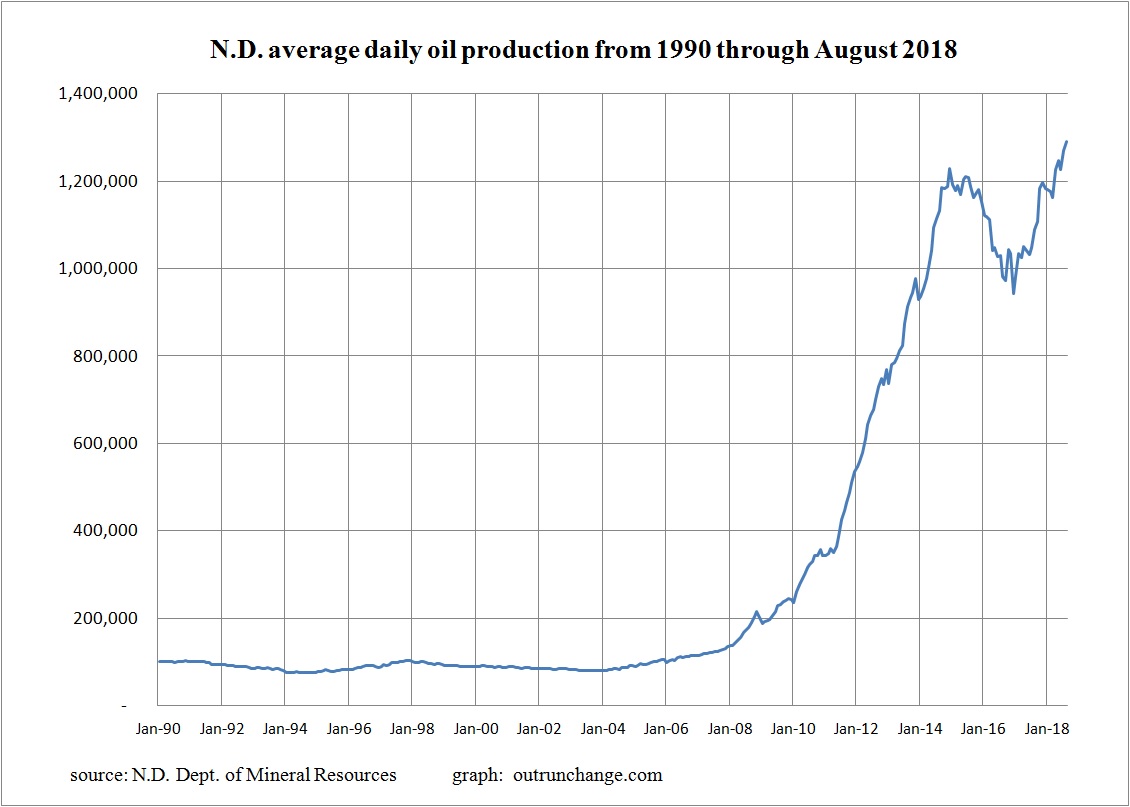
For a far longer perspective, look at the average production data since 1990. I like this graph because it shows a pattern of explosive growth from about 2008 through late-2014, a drop until around the end of 2017 and a rapid growth since then. The longer view:
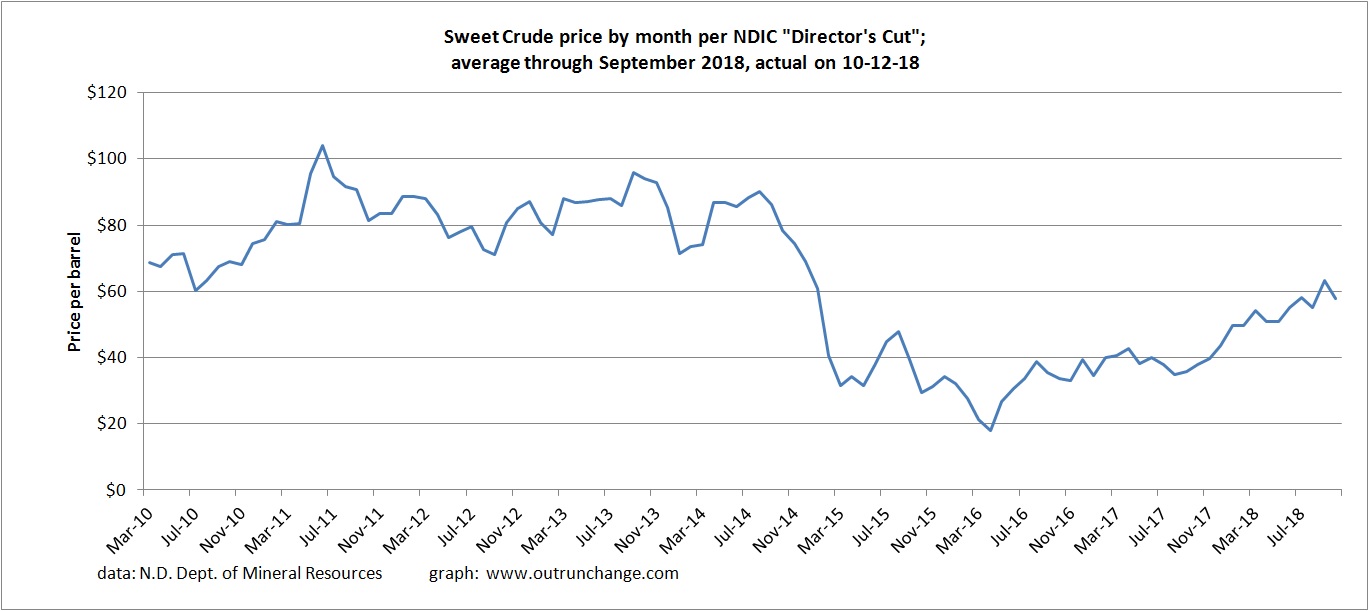
In addition, the price realized in North Dakota for sweet crude has been rising. Notice the steady upward slope since spring of 2016. Prices for sweet crude in the state:
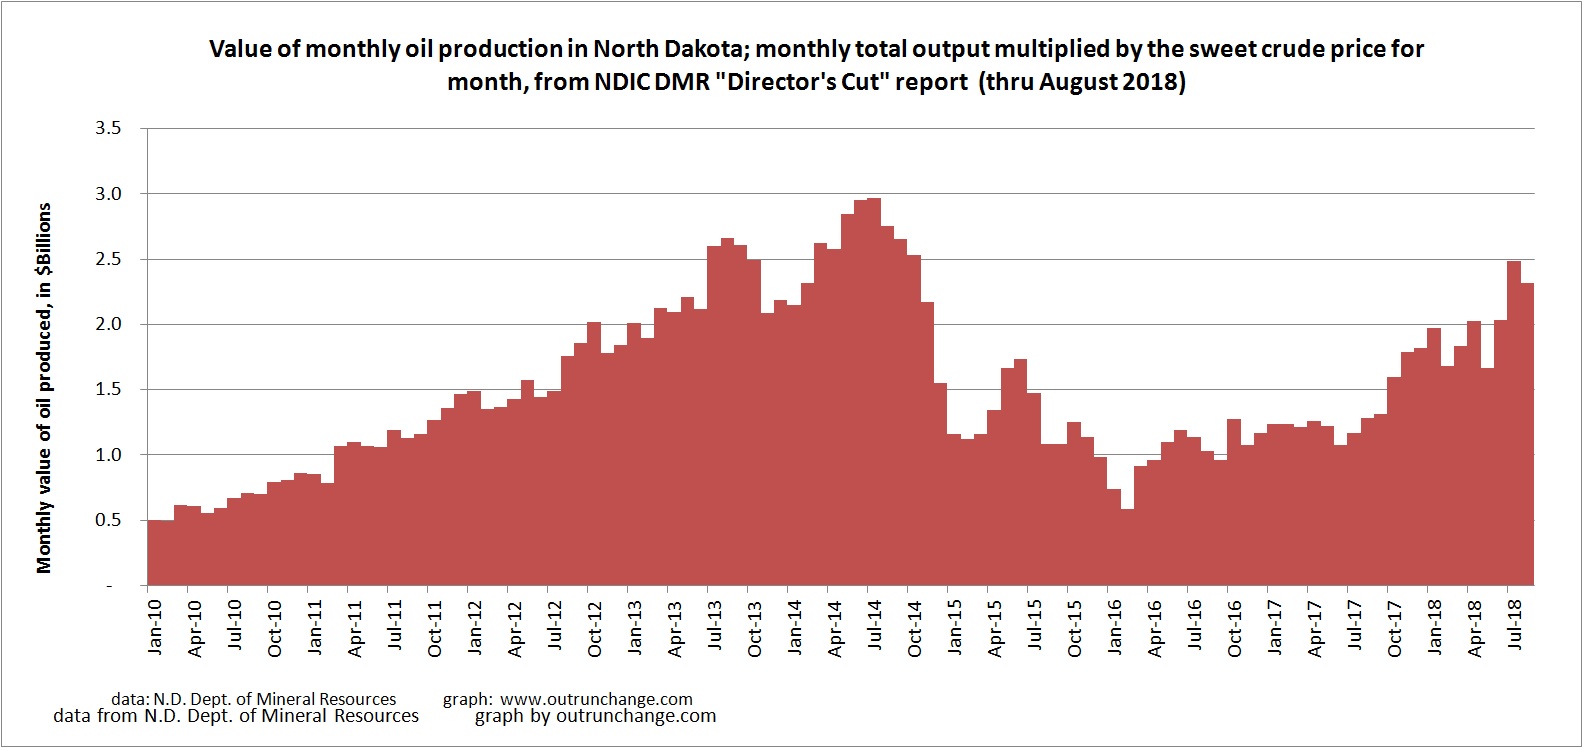
What is the value of that oil? Multiplying the monthly production amounts by the above average sweet crude prices in the state shows the statewide revenue for producers. Notice that a smoothed trend would show flat for most of 2015, all of 2016 and most of 2017 with steady rise since summer of 2017.


