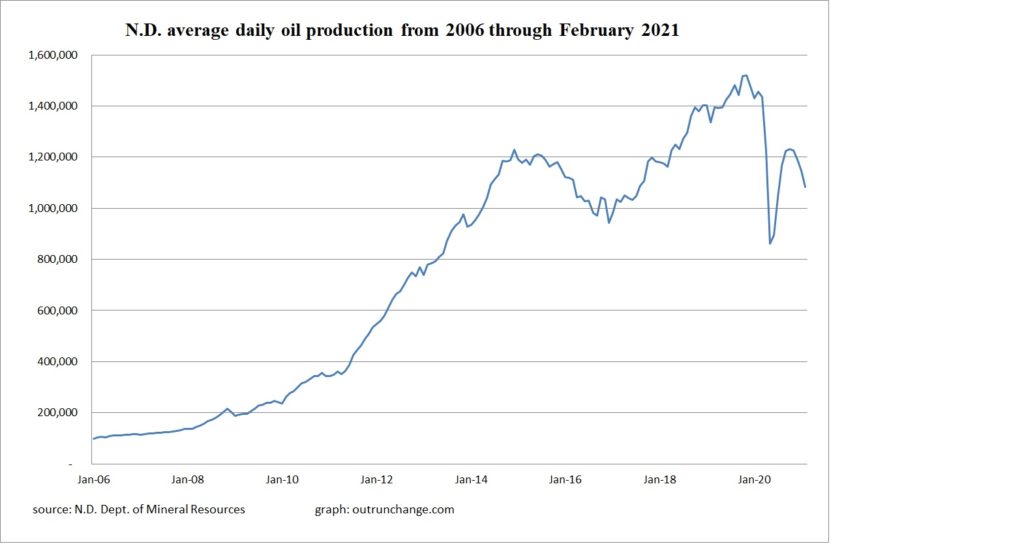
Graph above shows dramatic drop in production back in May and June 2020, caused by the drastic drop in prices. Record output in November 2019 of 1,519,032 bopd slowly declined then took a sharp drop to below 900,000 bopd in May and June.
Recovery thereafter increase production to just over 1.2M bopd in September, October, and November 2020. Production since then has dropped, with a significant decline in February 2021.
From high of 1,519,032 bopd in November 2019, two low of 862,349 bopd in May 2020, to high of 1,226,549 bopd in November 2020, to drop due to the weather of 1,083,020 bopd in February 2021.
Quite a roller coaster, huh?
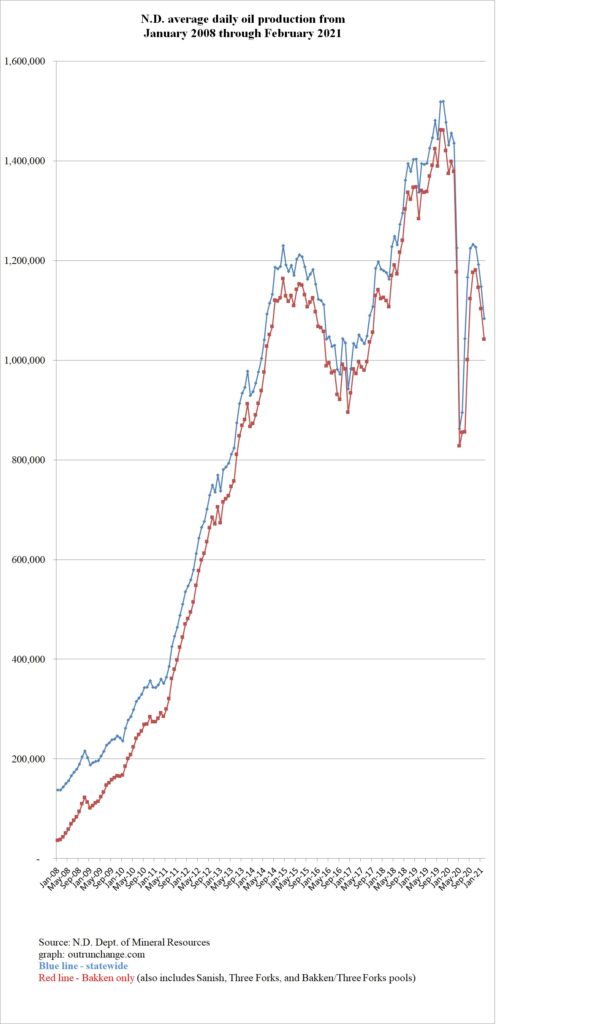
For more detail and to drill down deeper, including Bakken/Three Forks only and statewide data, check out:

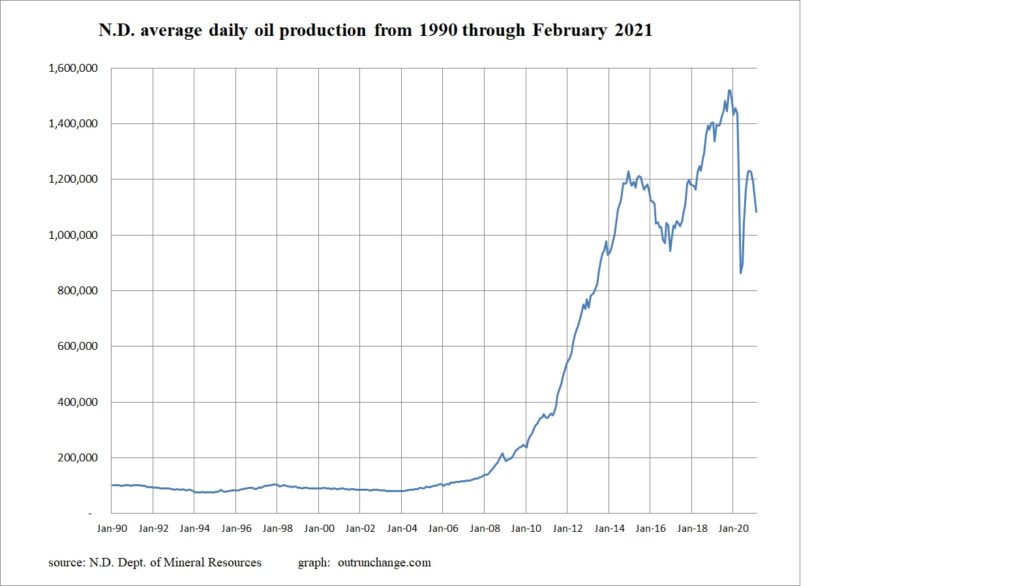
For a longer-term perspective, check out the monthly production since 1990:

Next post: value of monthly production, monthly prices, and number of wells & completions.