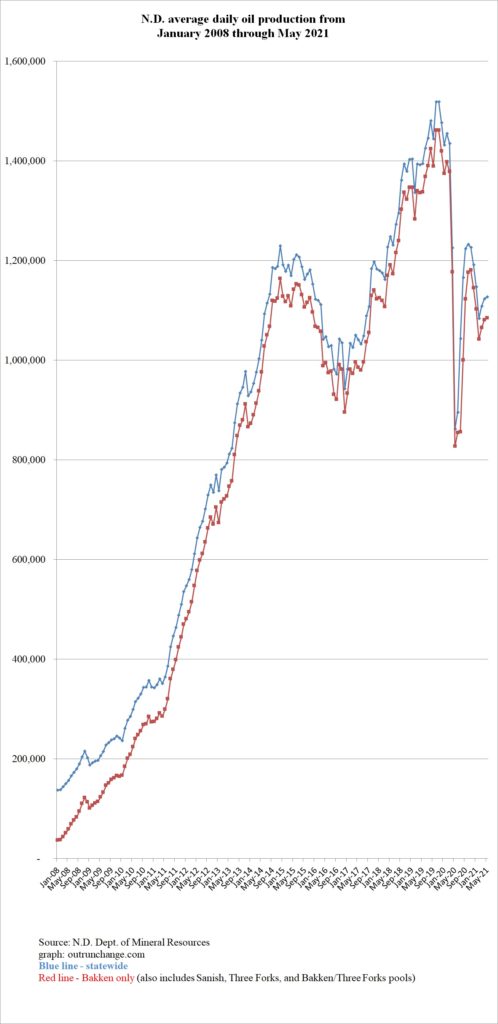
Graph above shows wild swings in oil production in North Dakota during the government shutdown of the economy due to the pandemic.
After a record high level of production of 1,519,032 barrels of oil per day (bopd) in November 2019, the production slipped slightly during the winter which it usually does. Production nosedived in April talking to 862k bopd in 5/20 and 895K boopd in 6/20.
Since then production slowly climbed back to 1.2M in September through November 2020 before dropping and having been in the range of around 1.1M bopd for the last five months.
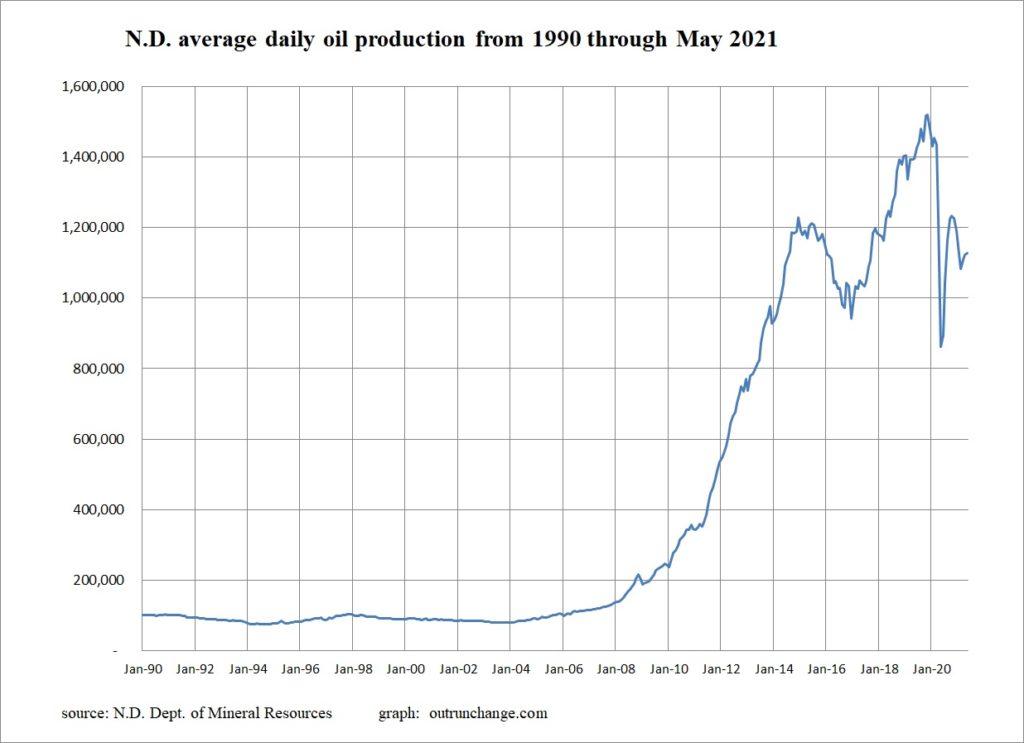
Here is a longer-term view of monthly production:

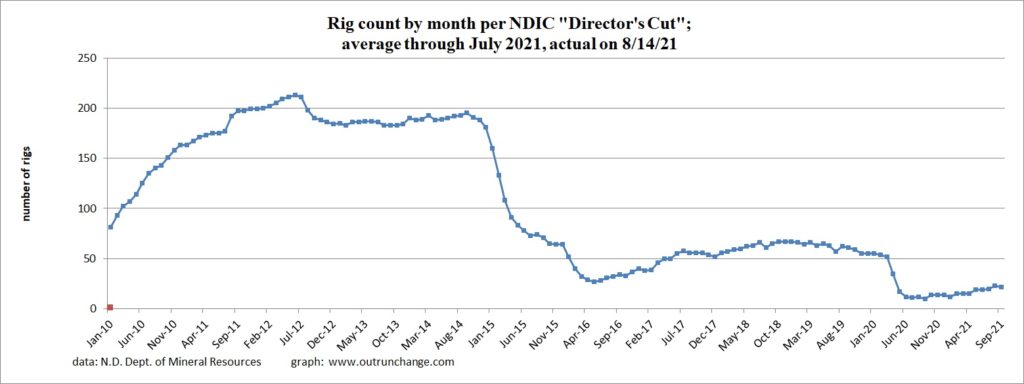
The number of rigs is no longer an indicator of the number of wells drilled or completed. However, it is still an indicator of the level of activity. After the number of rigs was in the 50s or 60s from April 2017 through March 2020 the rig count dropped to midteens in May 2020. It has been in the range since then.
After a recent low of 12 in January 2021, the rig count has been slowly increasing up to 22 now. A graph of the count:

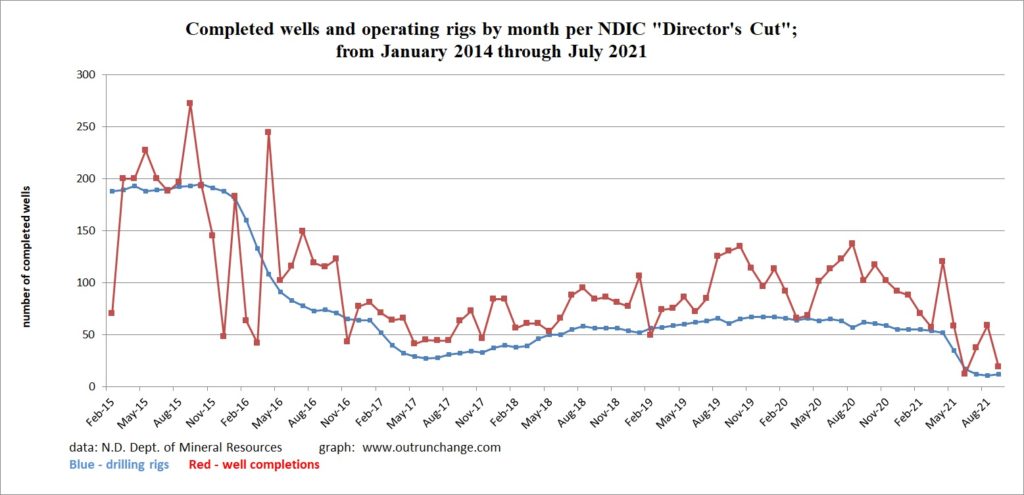
The number of wells completed has also been volatile with extremes of 120 in 3/20 followed by low of 12 in 5/20. Over the last six months the count has ranged from 31 in 4/21 up to 47 last month and 53 in 7/21. The completions overlaid with number of wells:
