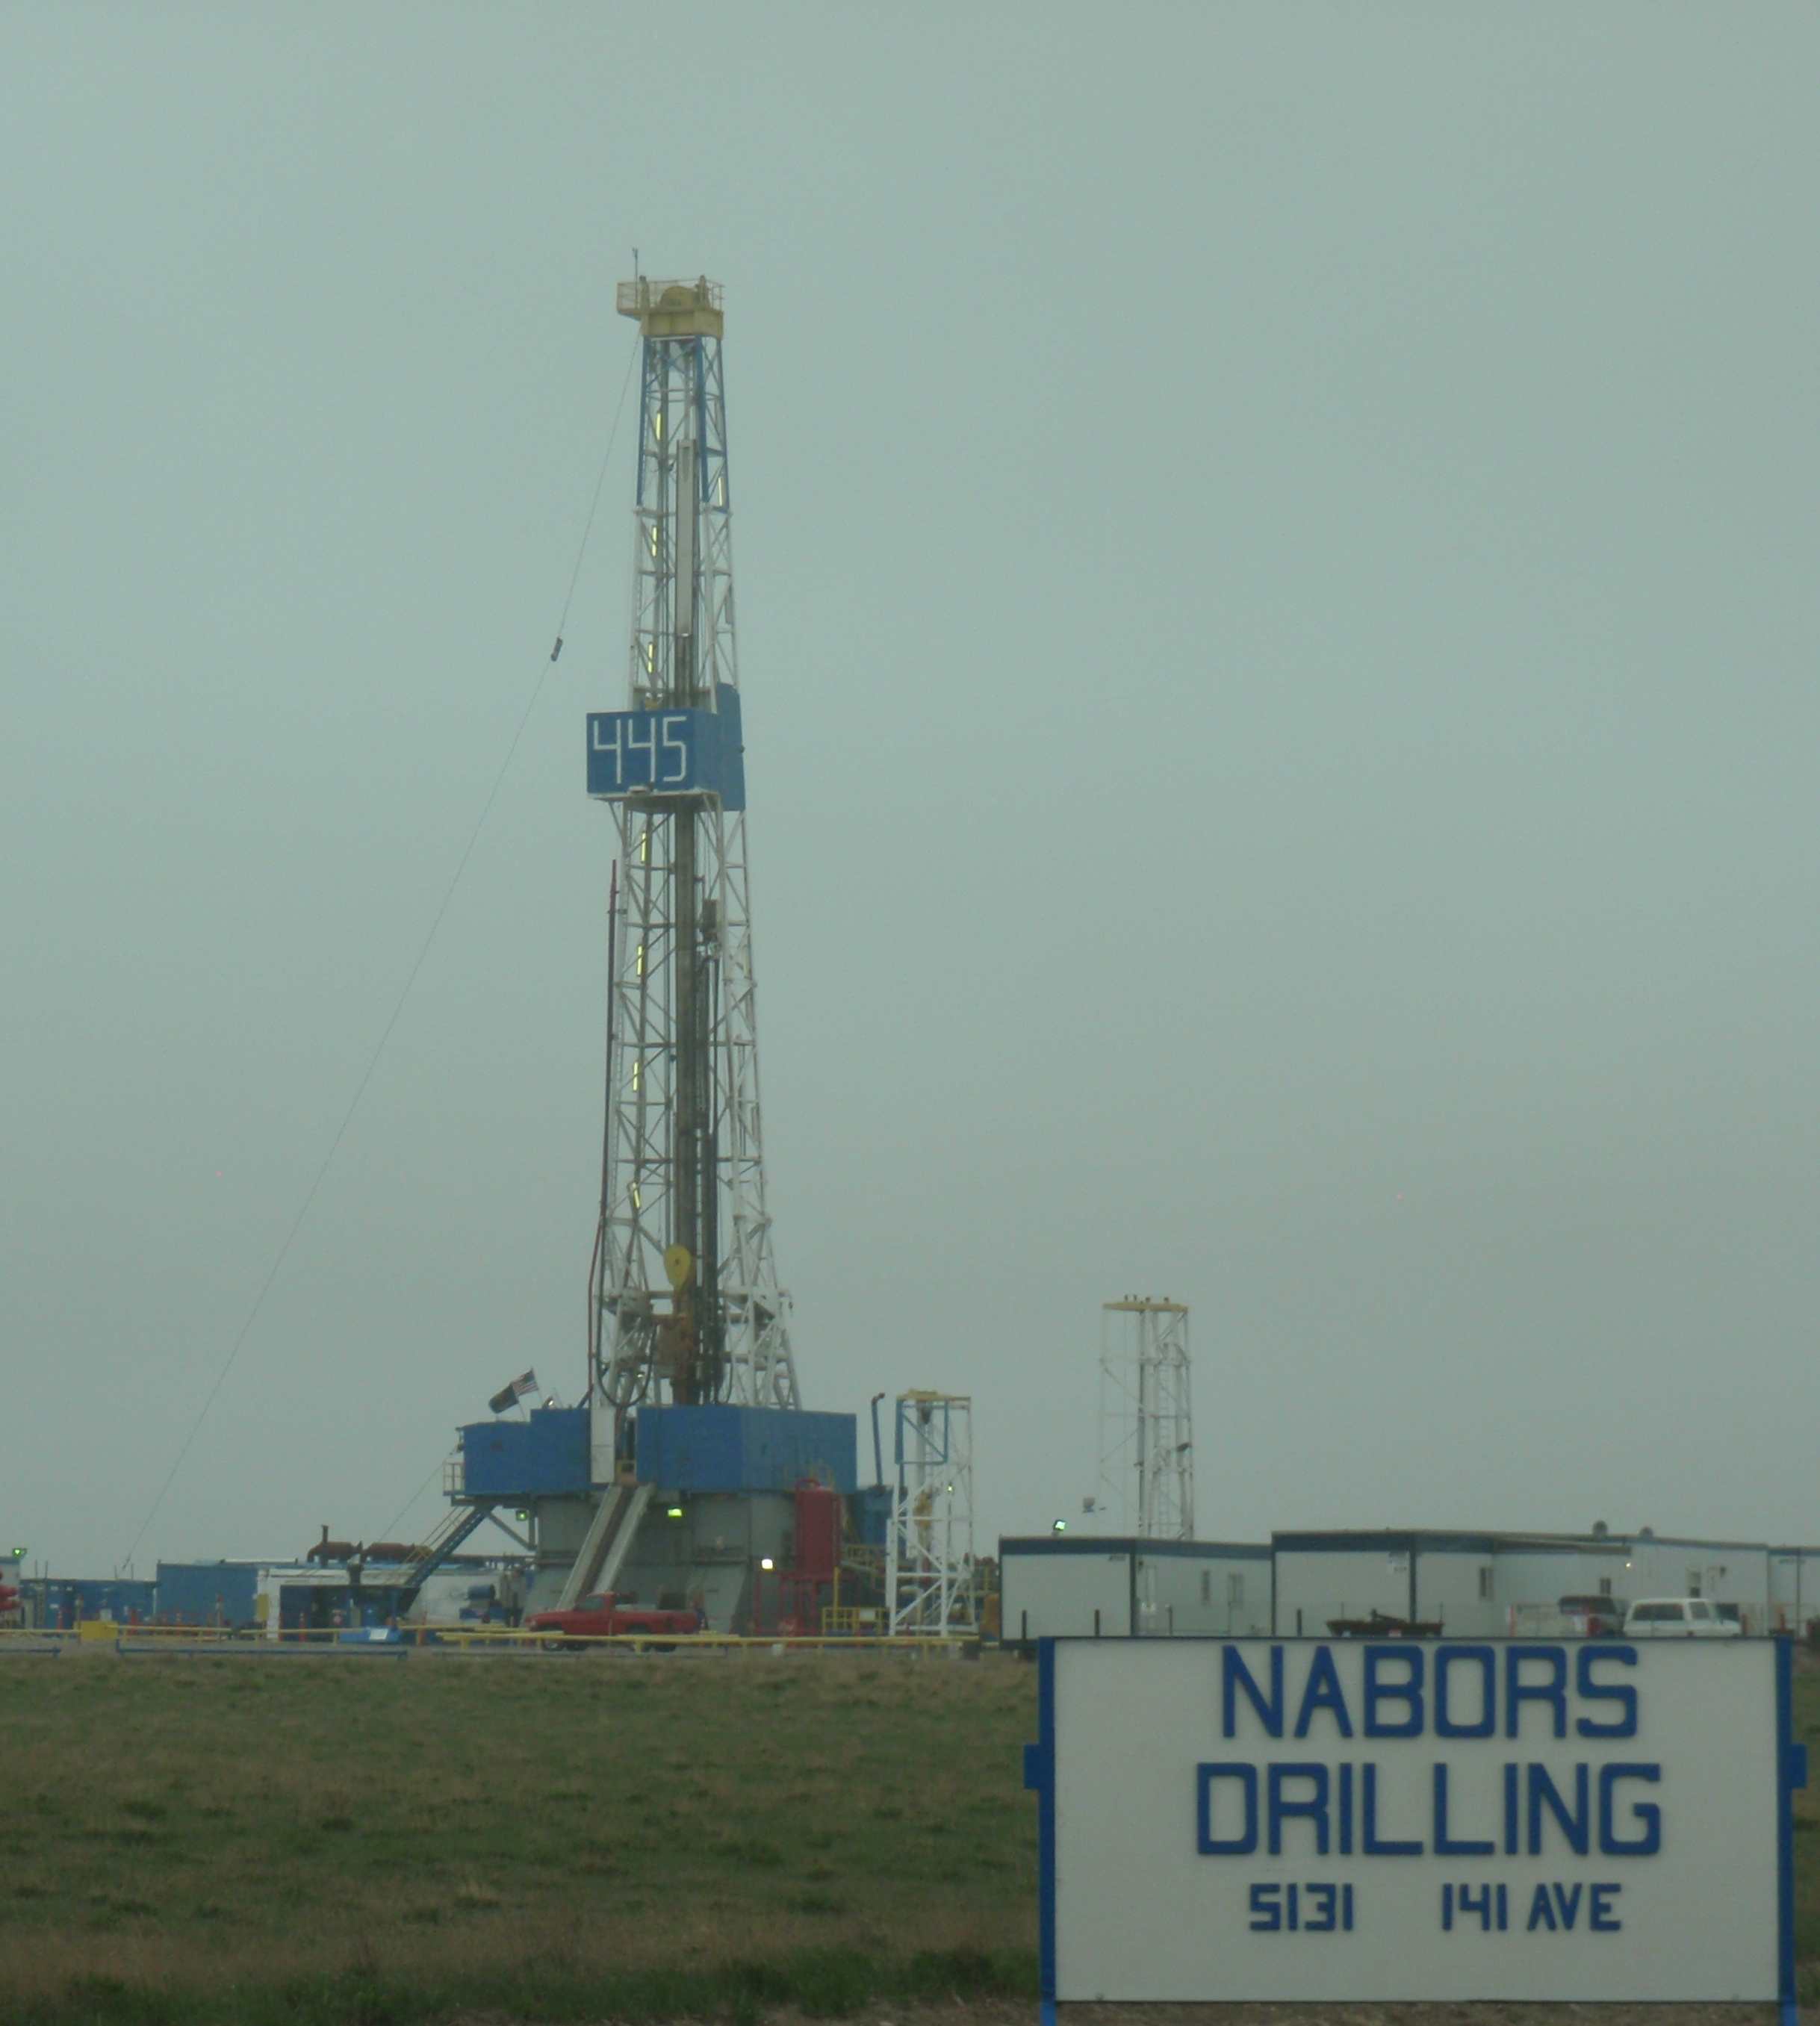
For some details on the production effort behind the rise in oil production in North Dakota, check out the number of rigs in operation and some indications of the results.
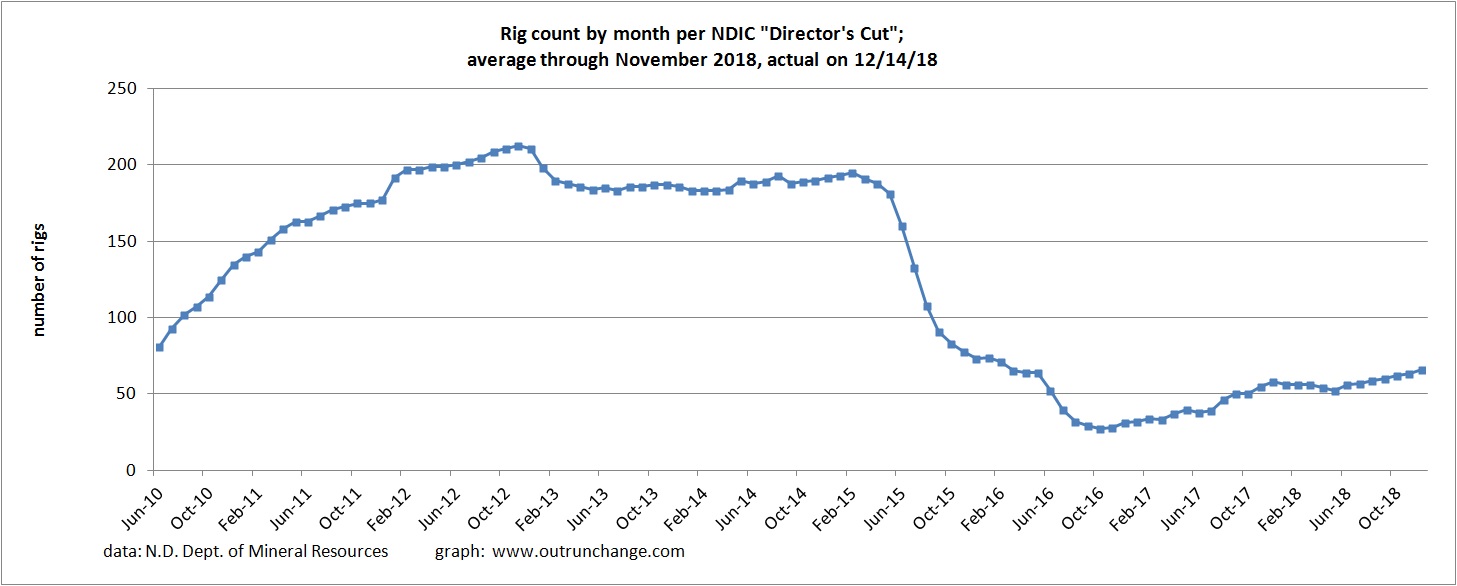
Number of rigs has been trending up since late 2016. This is response to increasing oil prices. The rig count dropped dramatically in 2015, which was OPEC’s goal in dropping prices. The drastic increases in efficiency of drilling mean the count of rigs in 2012 through 2014 is not comparable to the current count. Probably should be in two different graphs.
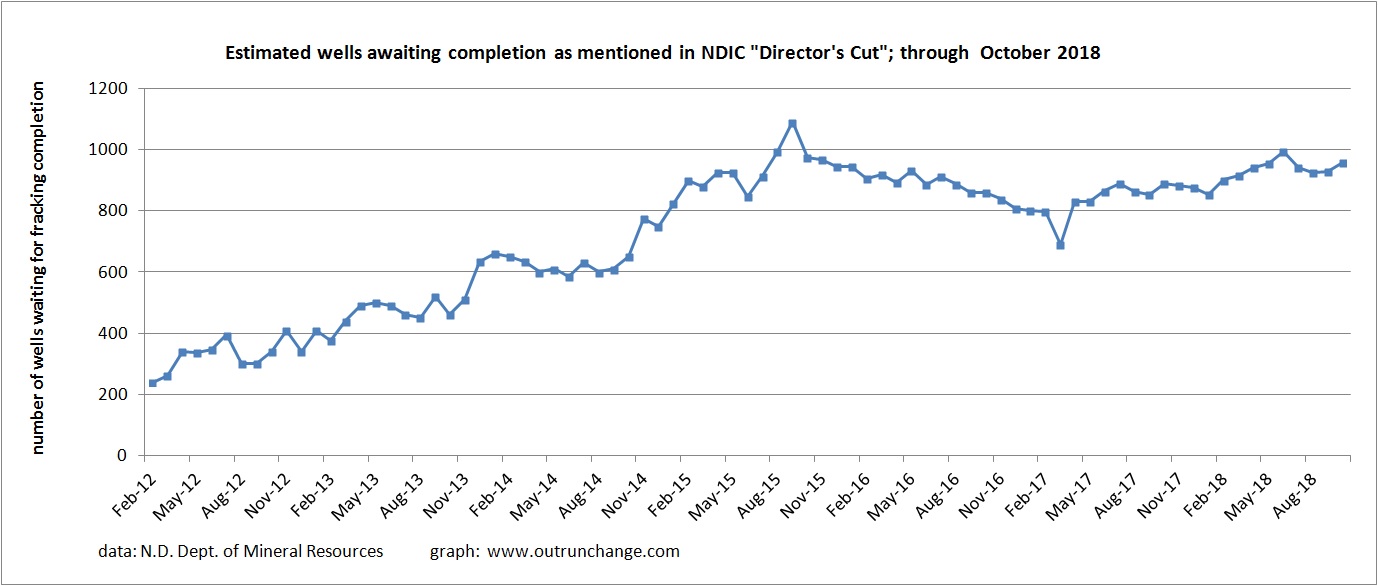
With the recent drop in prices, a larger number of the drilled wells are not immediately completed. Instead they are put in the fracklog category, essentially placed on the shelf as inventory awaiting completion until prices rise.
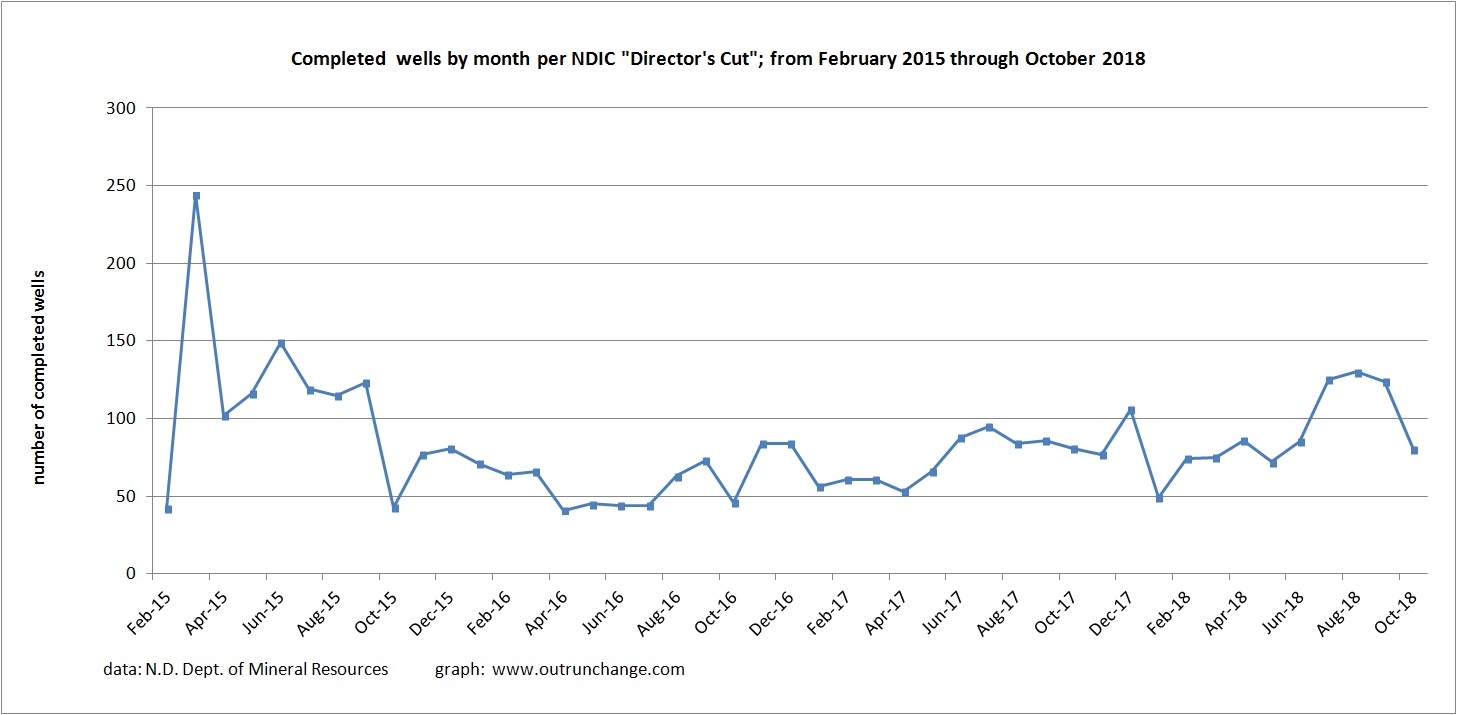
The dramatic productivity improvements in drilling operations no longer means there is a strong correlation between rig count and completion. Keeping that in mind, the wells completed are:
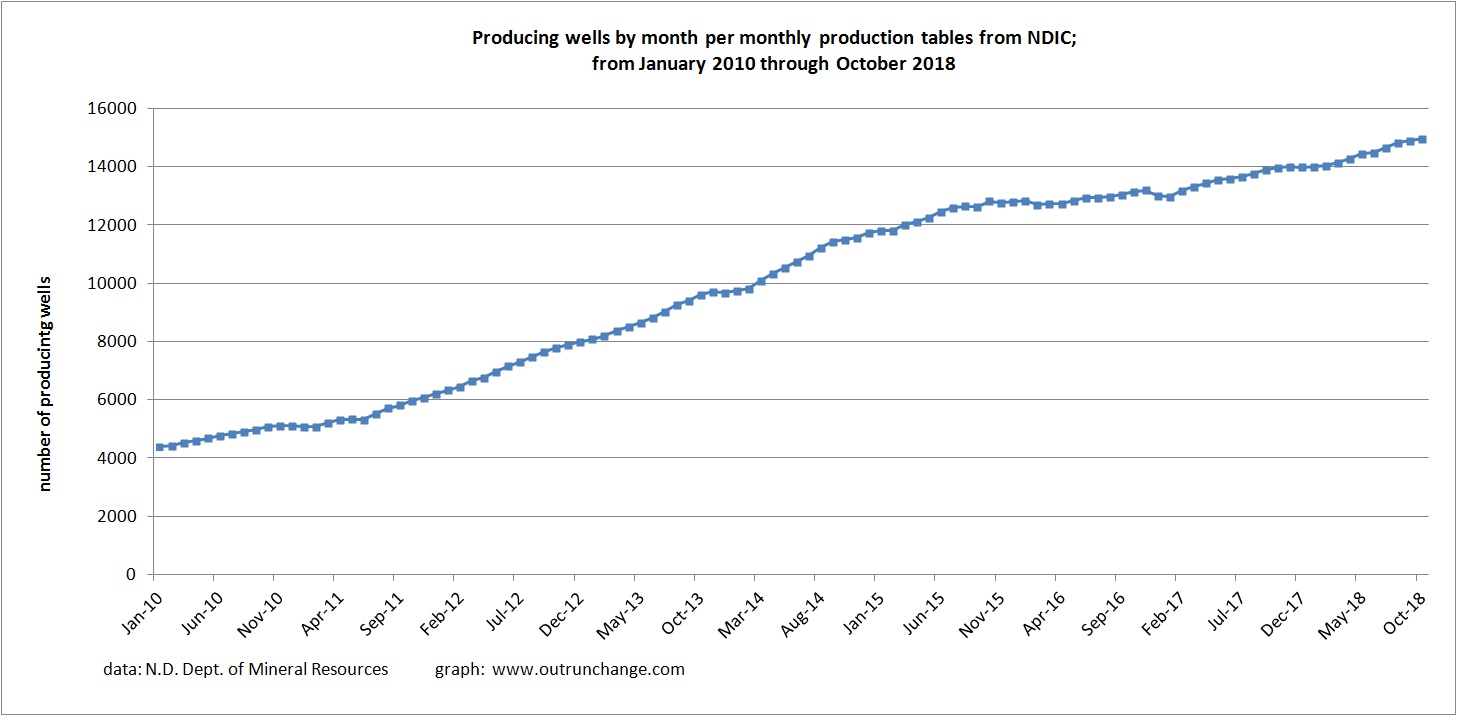
All of those factors, rigs running, wells drilled and fracking completed results in producing wells, which are trending up staring in 2017 after having flattened after oil prices dropped:
