Previous post showed a graph of average daily production in North Dakota. After a record high of 1.52M barrels of oil per day (bopd) in 11/19, production dropped to a seven year low of 862K bopd in 5/20. Production recovered to1.32M bopd in 10/20 before dropping to 1.08M bopd in 2/21 and sitting at 1.12M bopd in 4/21 and 5/21.
The good news for the state is oil prices have been recovering.
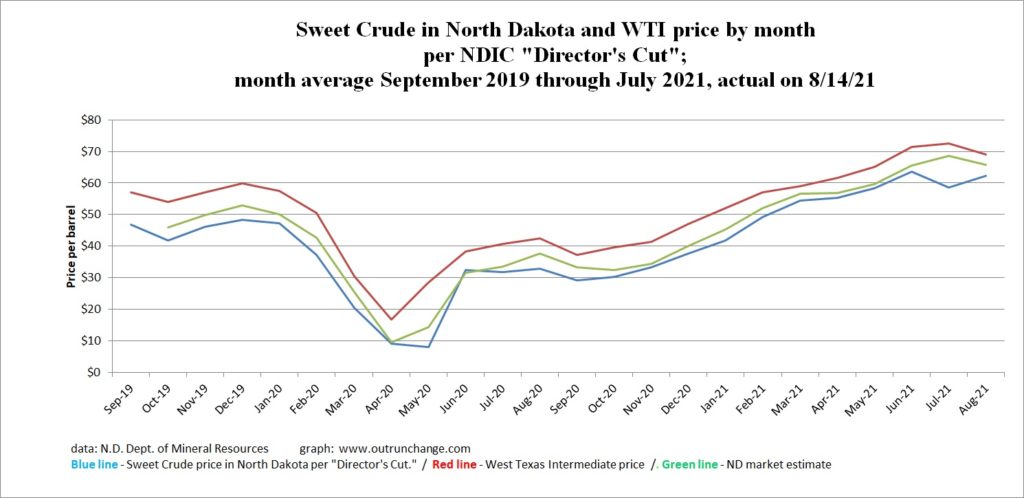
Prices for North Dakota light sweet had been in the $40s to low $50s for 2019 and most of 2020 before dropping and hitting a rocket disrupted price of $9.16 in 4/20 and $7.92 and 5/20.
Prices recovered to $32.35 in 6/20 and then slowly increased to $63.62 in 6/21 and are at average of $50.50 in 7/21.
All those prices are from the North Dakota Director’s Report.
Graph at the top of this post shows the4 North Dakota Light Sweet, West Texas Intermediate, and an estimate for the average price realized in North Dakota.
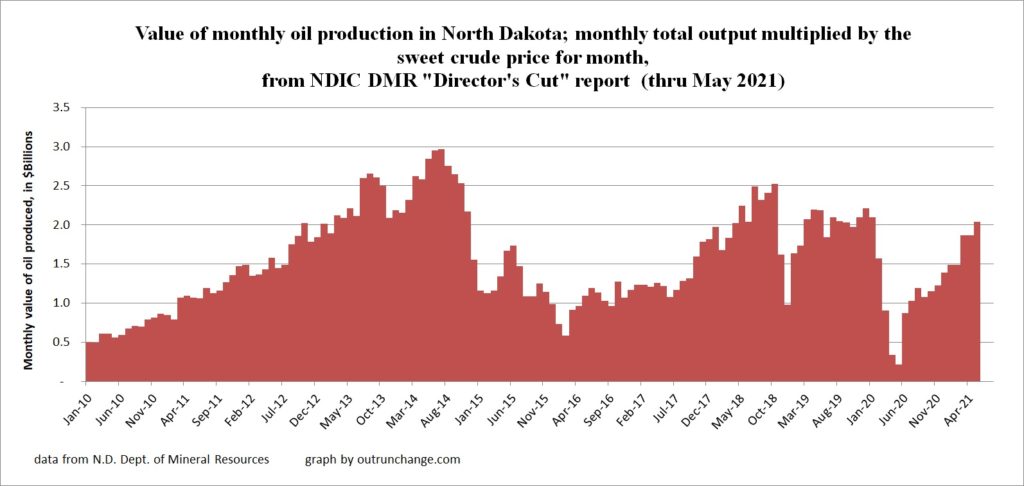
What does the dramatic swing in prices combined with the dramatic swing in production look like in terms of the amount of revenue realized by producers?
If we multiply the average North Dakota Light Sweet price by the average daily production we can calculate the value of oil produced. My graph shows the following results:

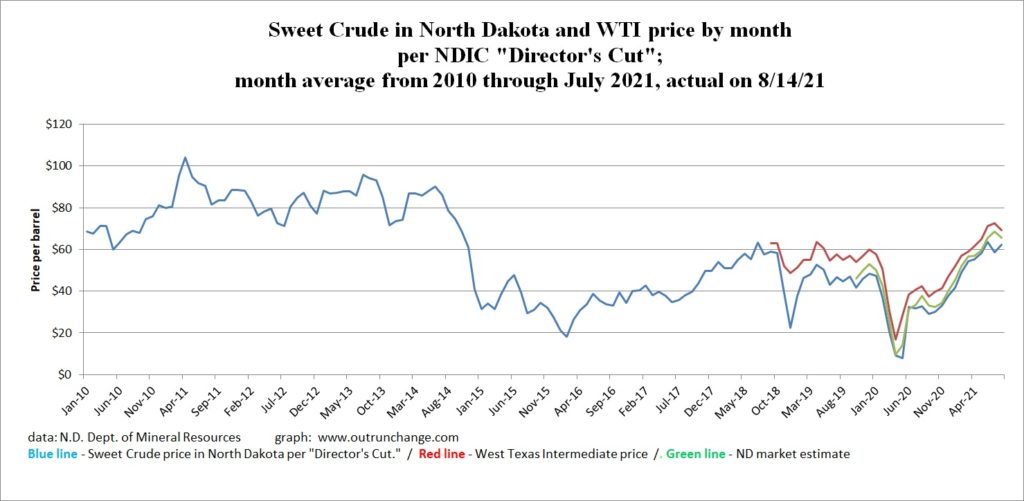
Here is a longer-term horizon for the price of oil in the state:
