Here’s a few graphs of North Dakota oil production.
Click on any graph to enlarge.
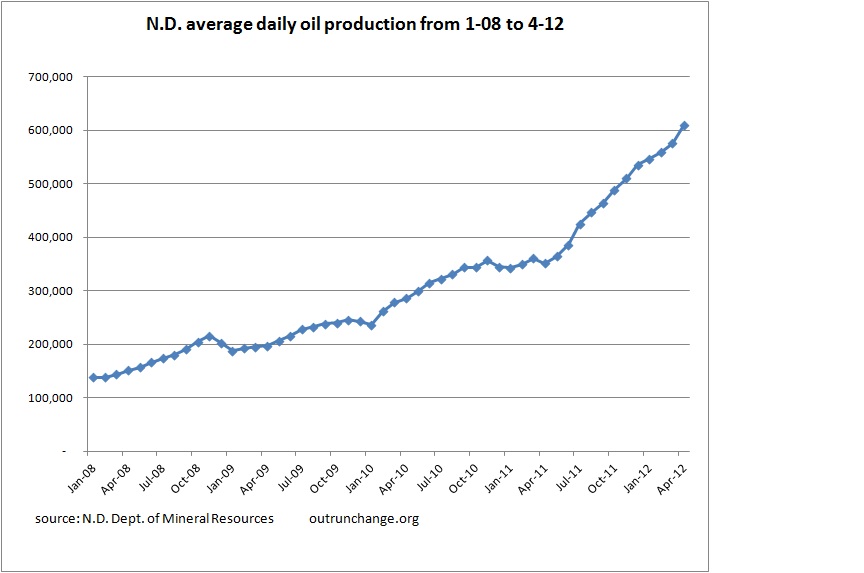
Average daily production by month:
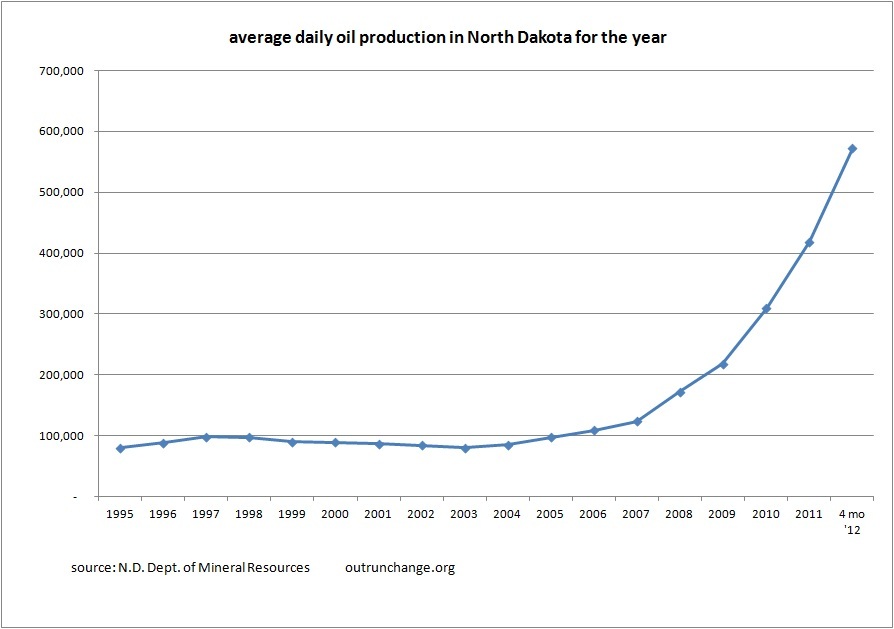
Annual average of daily production (calculated as total production for the year divided by 365, except for 2012 which is divided by 121):
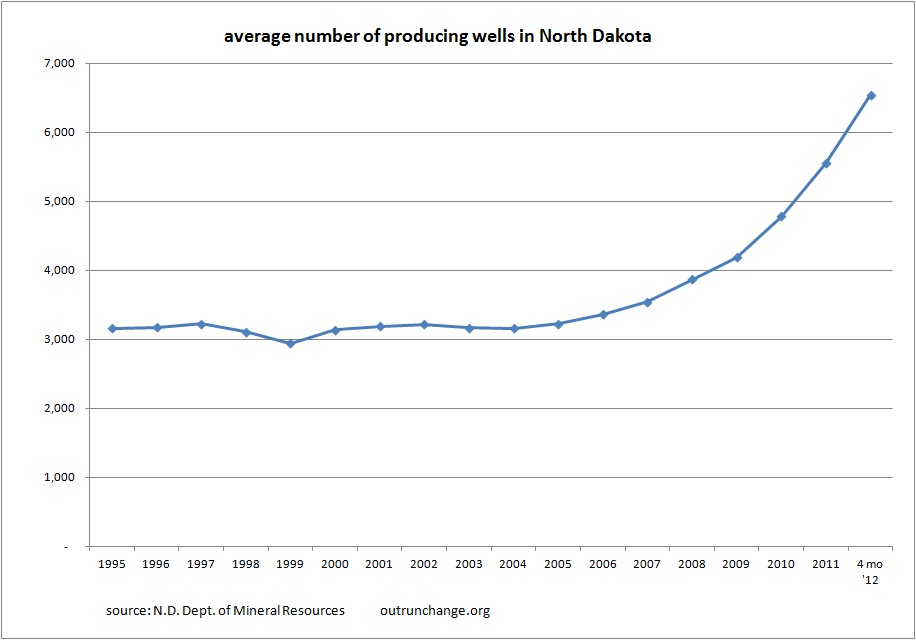
Average number of producing wells by year (calculated as total of wells each month divided by 12):


