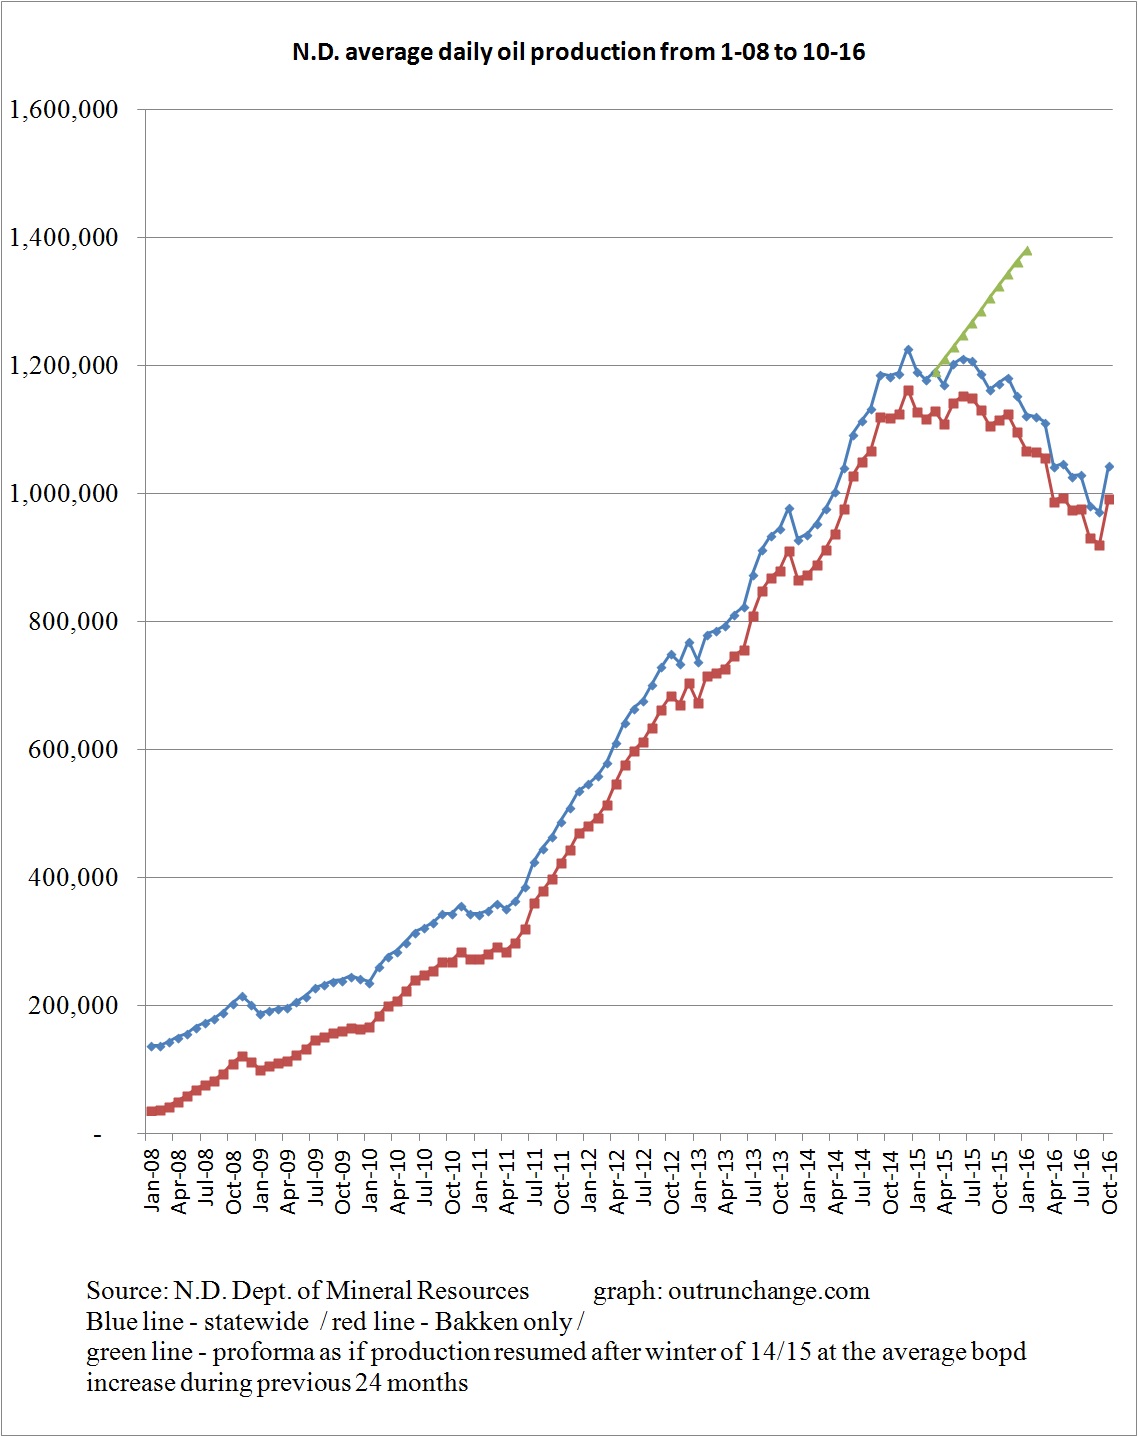
Production saw a big increase in October. Output climbed from 971,760 in September (final) to 1,043,207 (preliminary). That is a 7% jump, moving production across the 1M point. That is a big increase. Why? Then some comparisons, then a couple of graphs.
Lynn Helms attributes the increase to operators opening up wells that had been throttled back and a few big wells coming on line, according a quote in the Wall Street Journal, North Dakota Crude Oil Output Rises to a Five-Month High. Yeah, the WSJ quoted Mr. Helms. They ran an article the day of his press conference to discuss the monthly report. How ‘bout that?
That is an increase of 71,447 bopd, the largest increase in one month going all the way back to 1989. Other months with increases of 40K bopd or more were:
- 54,065 – September 2014
- 52,099 – June 2014
- 50,845 – July 2013
- 42,653 – February 2013
That is an increase of 7.35%. Going back to 1989, the only months with a higher increases on a percentage basis were:
- 10.2% – July 2011 – up 39,351 bopd
- 10.6% – February 2010 – up 24,958 bopd
Some graphs…
Average daily output state-wide and Bakken only:
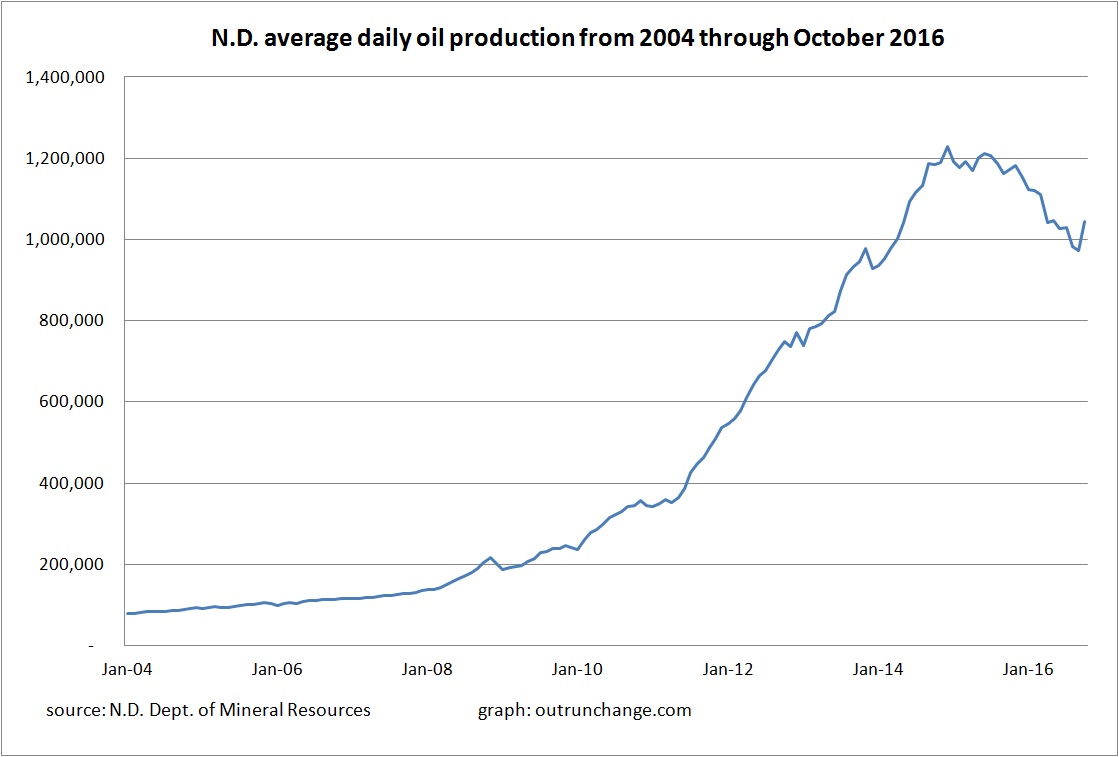
Average daily output since 2004, for a longer term perspective.
More graphs tomorrow.

