Yesterday mentioned there was a big increase in oil production. Up 71,447 bopd in October, an increase of 7.35% for the month.
Here are a few more graphs to tell the story…
Value of monthly oil production, calculated by multiplying the rate cited in The Director’s Cut for average wellhead price in the state multiplied by average daily production. Amounts are in billions of dollars.
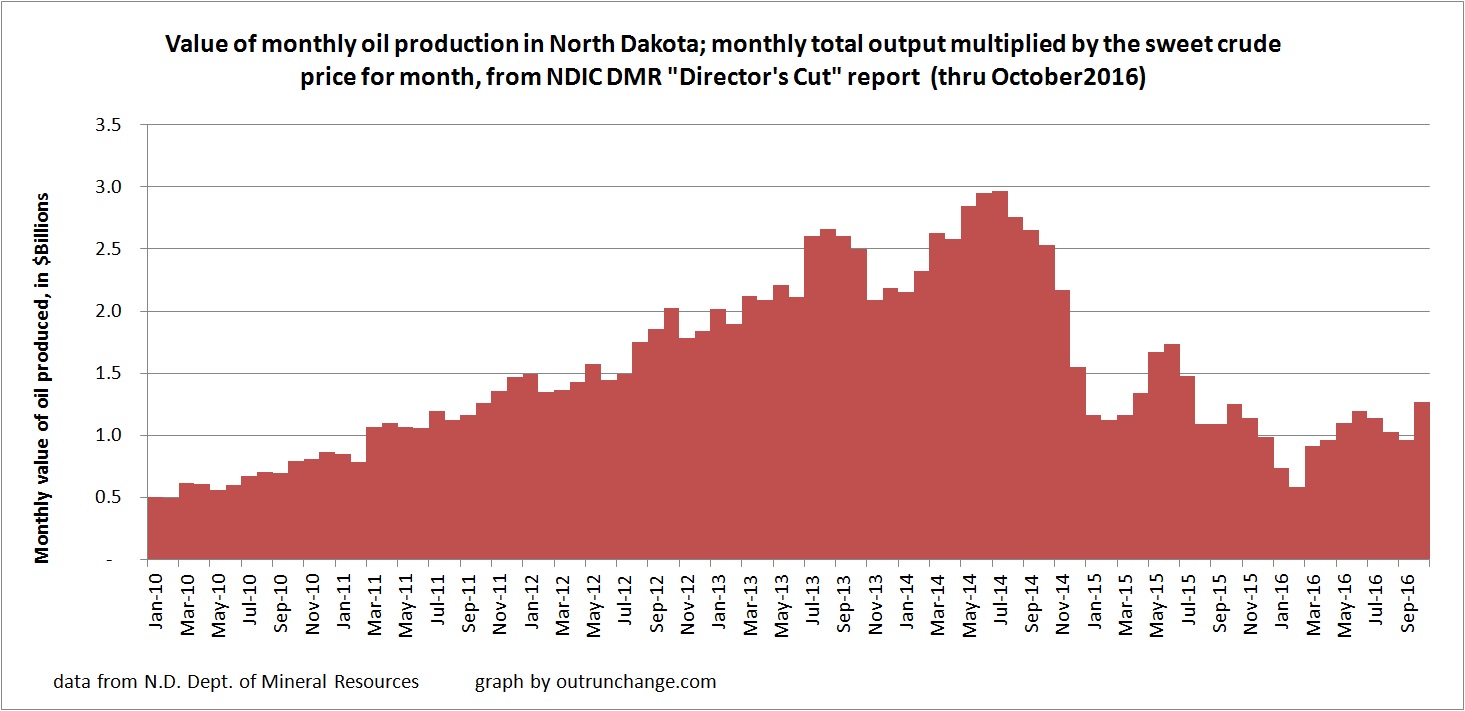
Average daily price in the state. This feeds the previous graph. Notice the substantial up tick in the last several months.

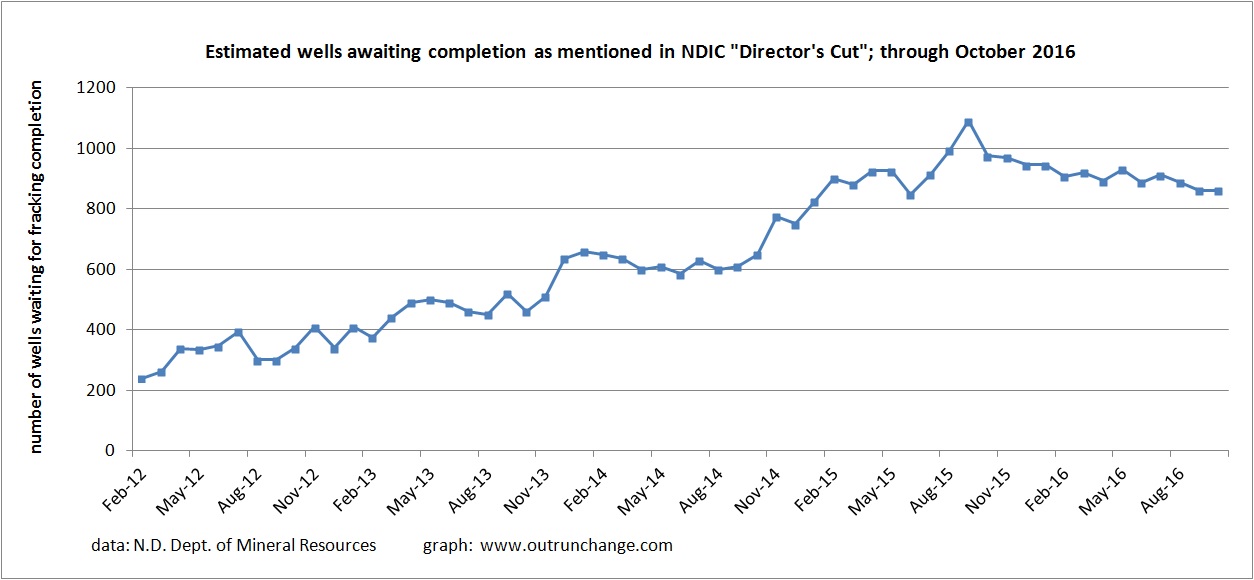
The fracklog. This is the count of wells that have been drilled and only need to be fracked before they can start producing. By the way, that represents a huge amount of oil than can be on the market in short order.
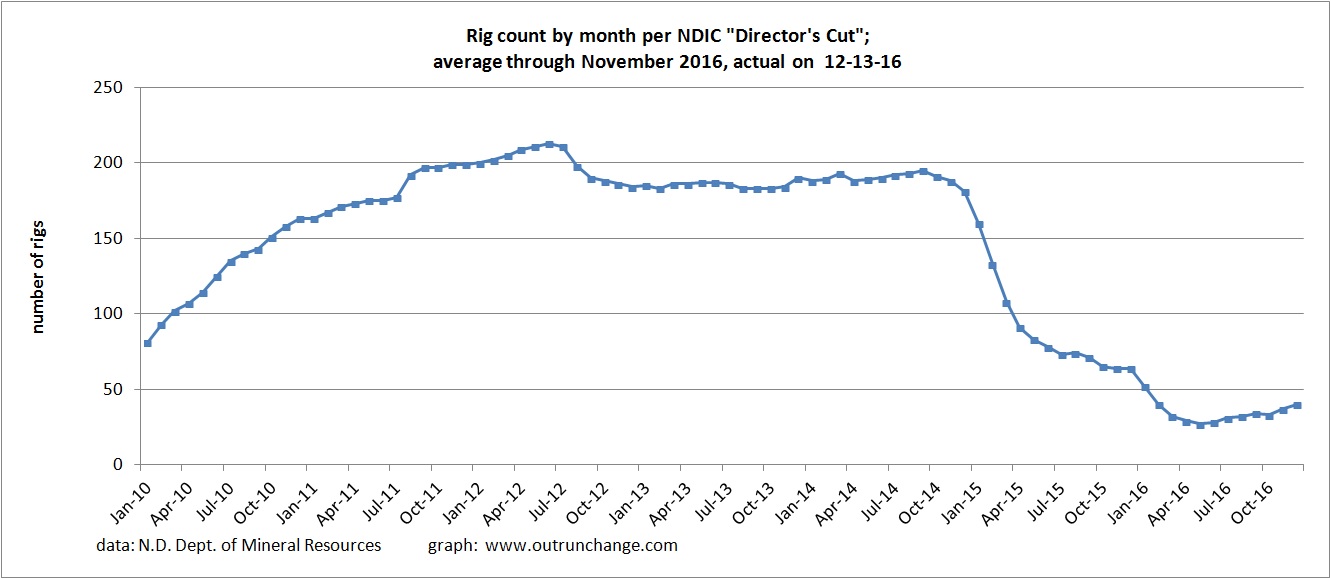
Finally, the average rig count by month. Keep in mind that the productivity of a well has increased dramatically in the last few years. Forty wells today can drill a lot more wells than 40 wells could have drilled two or three years ago.
One thought on “More graphs for background on North Dakota oil production in October 2016”