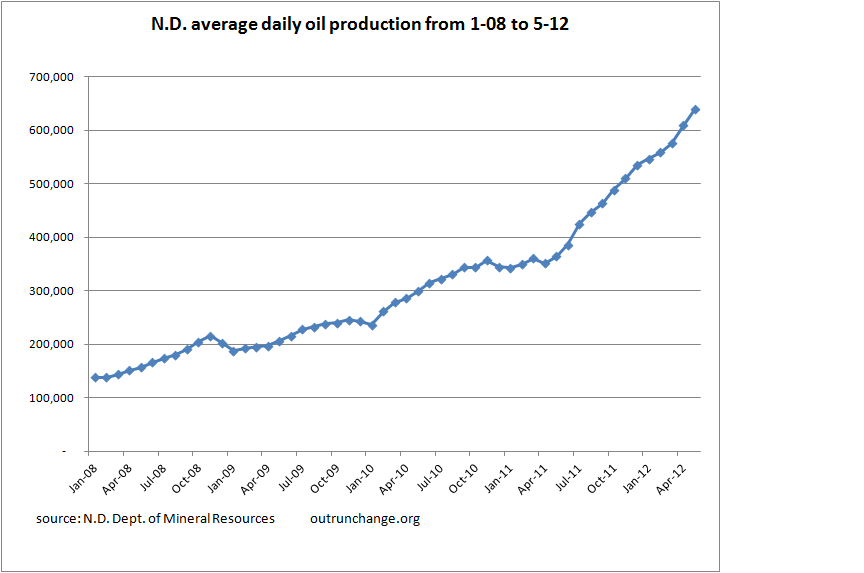
Average daily oil production in North Dakota for May 2012 was 639,277 bopd, which is an increase of 29,904 barrels per day over April, or 4.9%. The April increase was 33,883 bopd, or 5.9% for the month. Increase in March was 17,235 bopd, or 3.1% over February.
Number of wells increased to 6,954.
You can find the data here.
Here is a graph of monthly production:

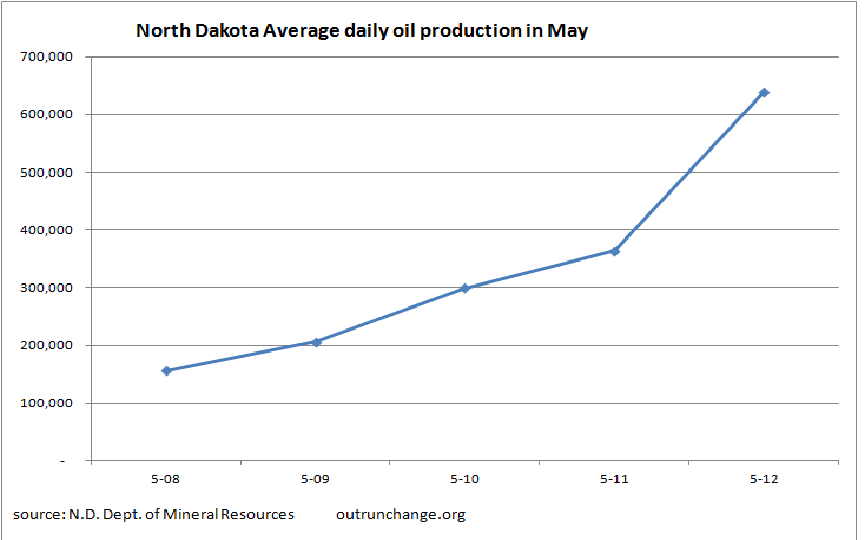
For some longer term perspective, here is the production data for the month of May over the last 5 years.
| ave daily | ||||
| production | % chg | wells | % chg | |
| for month | ||||
| 5-08 | 156,420 | 3,811 | ||
| 5-09 | 205,995 | 32% | 4,135 | 9% |
| 5-10 | 298,981 | 45% | 4,684 | 13% |
| 5-11 | 363,974 | 22% | 5,338 | 14% |
| 5-12 | 639,277 | 76% | 6,954 | 30% |
Here is that data in a graph:
