I mentioned the dropping costs of production in Eagle Ford in this post.
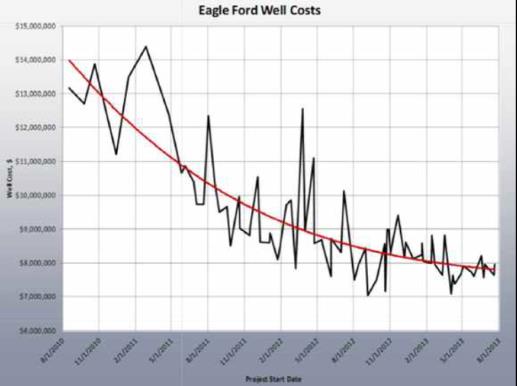
Here’s the graph in the presentation slide deck for the 2013 report from the University of Texas San Antonio:
Thanks to R.T. Dukes of EagleFordShale.com for permission to repost his graph. Thanks to Professor Thomas Tunstall for a copy of the slide presentation.
Check out the rapid decline. Looks like the decline is slowing. Looks like the drilling costs are settling in at under $7M. Also notice the variability, which is exactly what would be expected.
Did I mention lately that if you’re reading my blog you should be following EagleFordShale.com?Next post will discuss the reasons production costs are dropping in Bakken. Some of the factors apply in Eagle Ford, but mostly I think they reflect Bakken catching up in terms of infrastructure.
