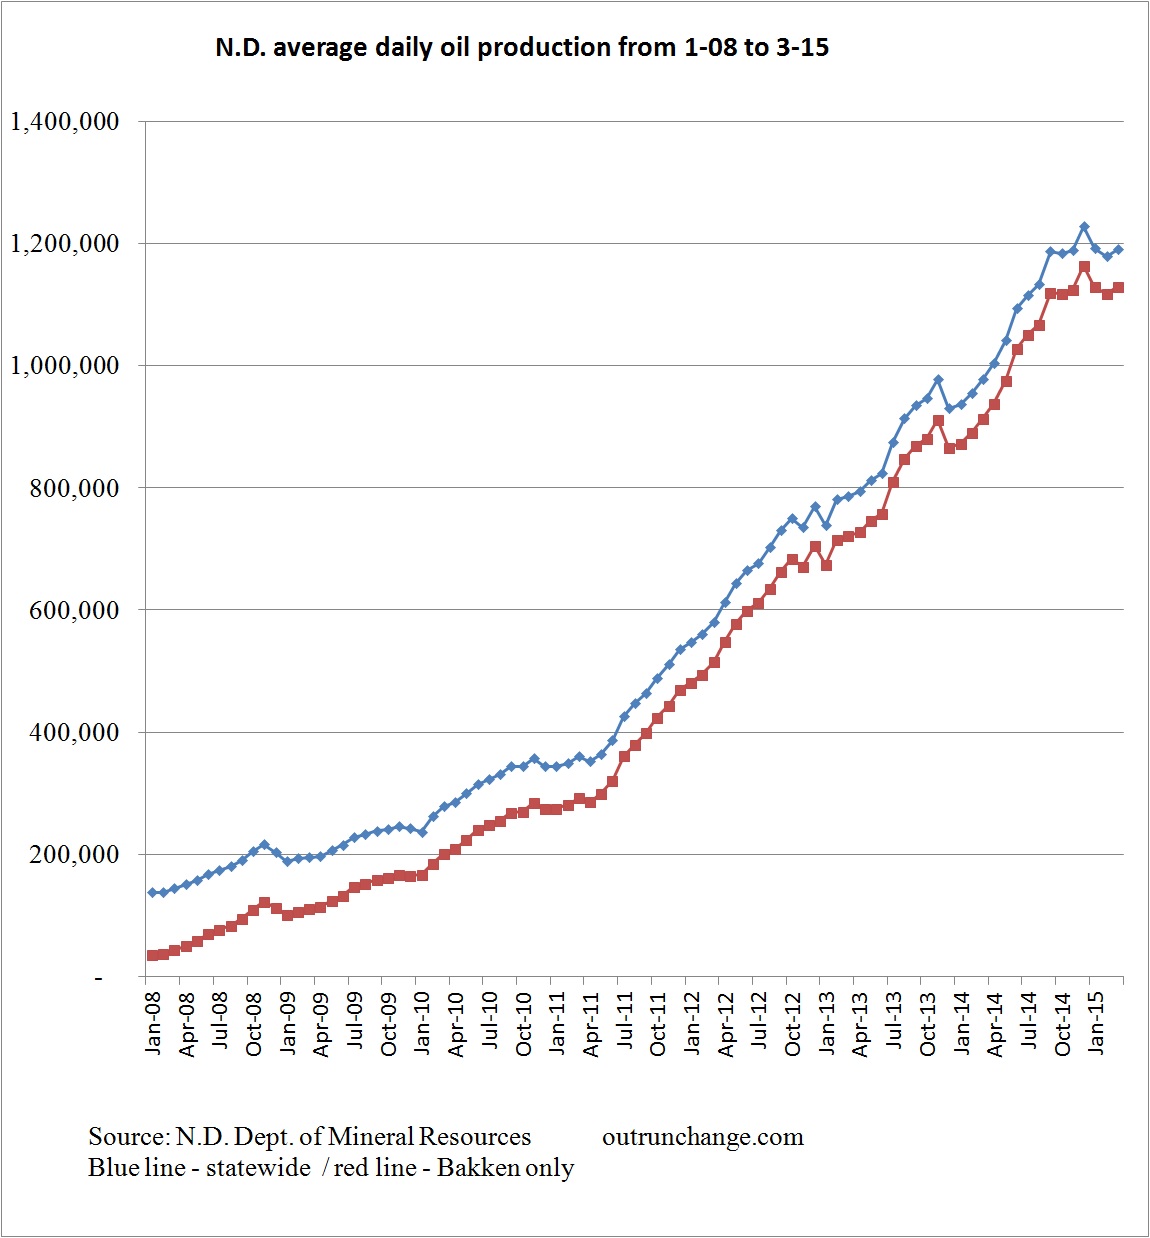
The preliminary March production info is in – average daily production increased to 1,190,538 bopd from a very slightly revised 1,170,082 bopd in February. That increase of 12,501 bopd essentially offsets the decrease of 13,116 bopd in February.
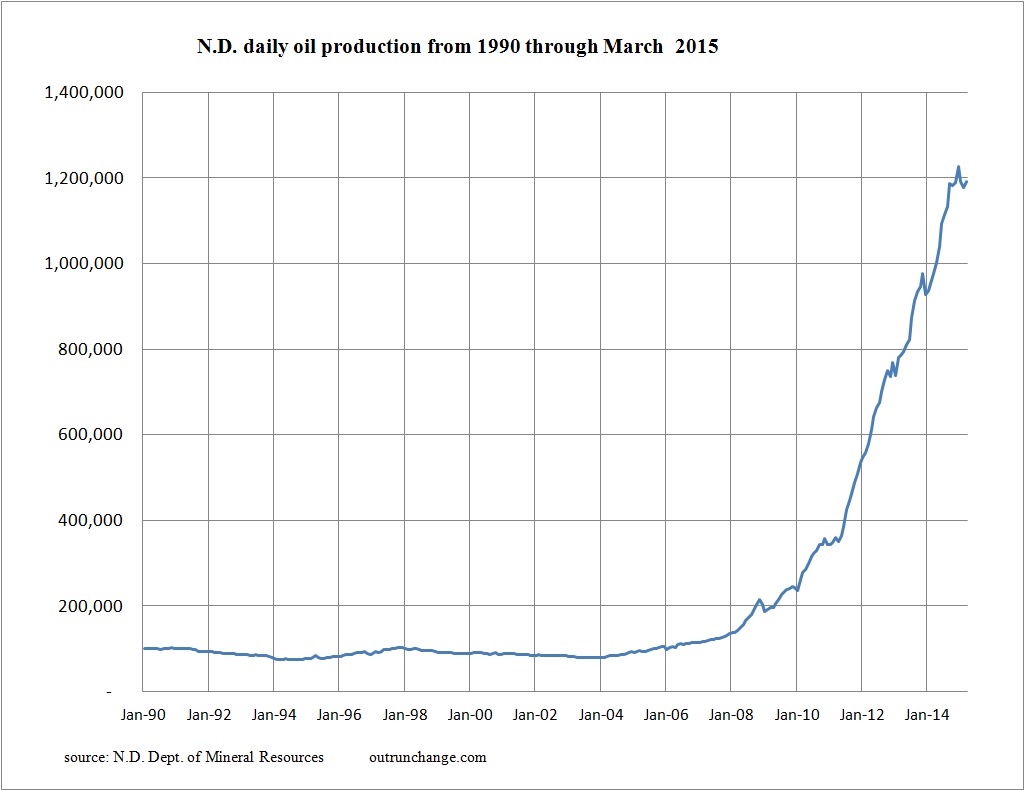
Here is a graph of current production on a long-term perspective:
The peak in December 2014 was 1,227,529 bopd. March 2015 production is a drop of 36,946 bopd.
Last few months look kinda’ sorta’ like a plateau, doesn’t it?
Take a look at the following production graph. Do you suppose that is the change that OPEC wanted to see when they decided to maintain production in order to crush the American shale sector?

