[youtube=https://www.youtube.com/watch?v=3ZYVN_7PG_M]
(Shaky videography and editing by James Ulvog)
Yesterday mentioned that oil production in North Dakota during June increased slightly to the second highest on record.
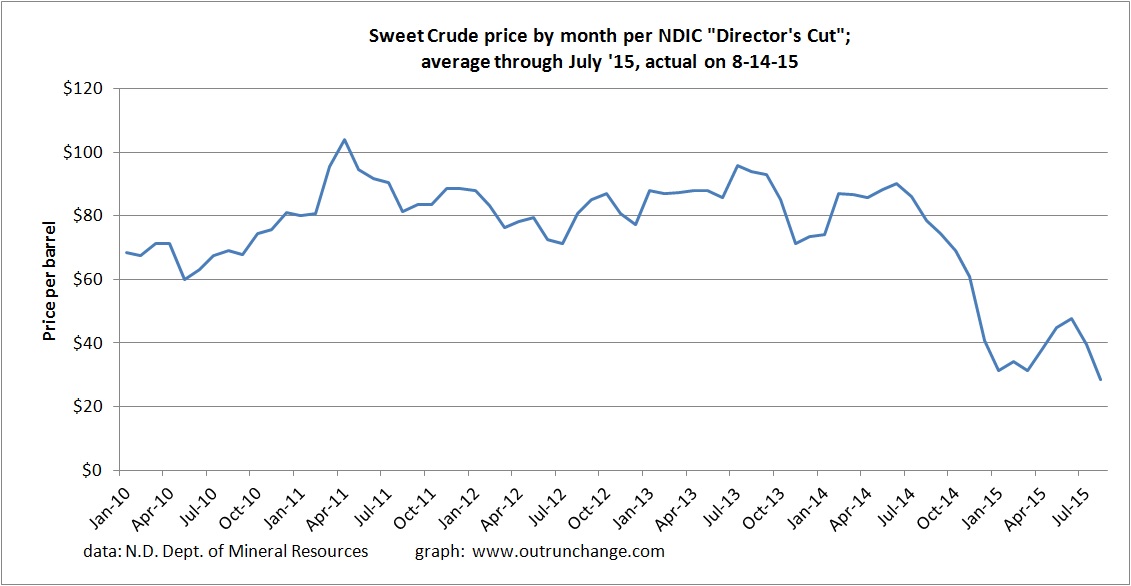
The wellhead price of crude in North Dakota has dropped again as has the WTI and Brent indices.
Here is a graph of prices in North Dakota:
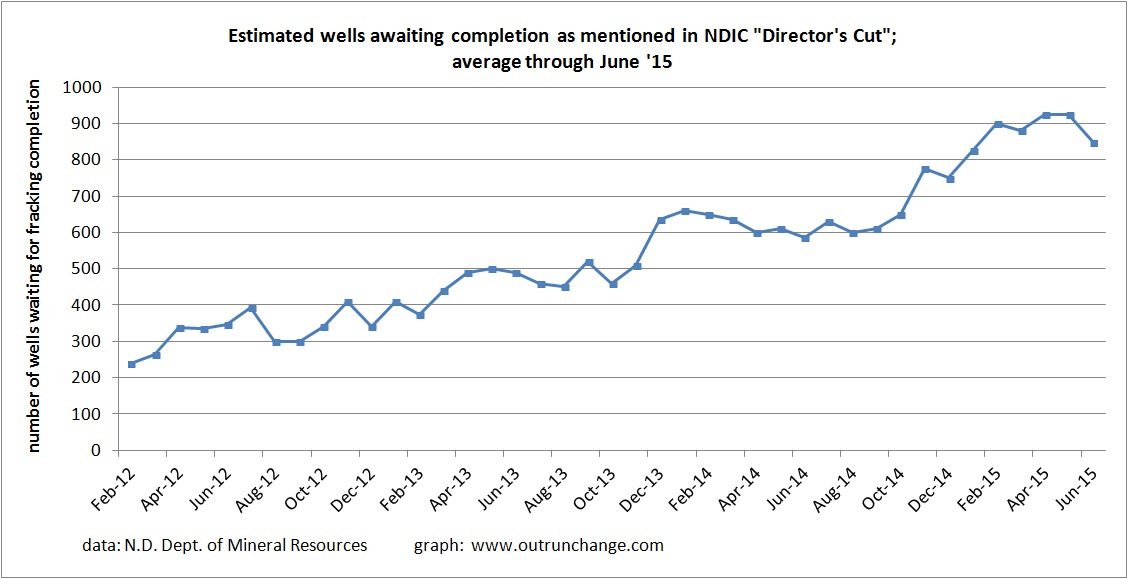
Here is a graph of the fracklog, wells waiting for completion.
Part of the drop in June is because some wells hit the one year mark, at which time they must either be completed or closed in.

