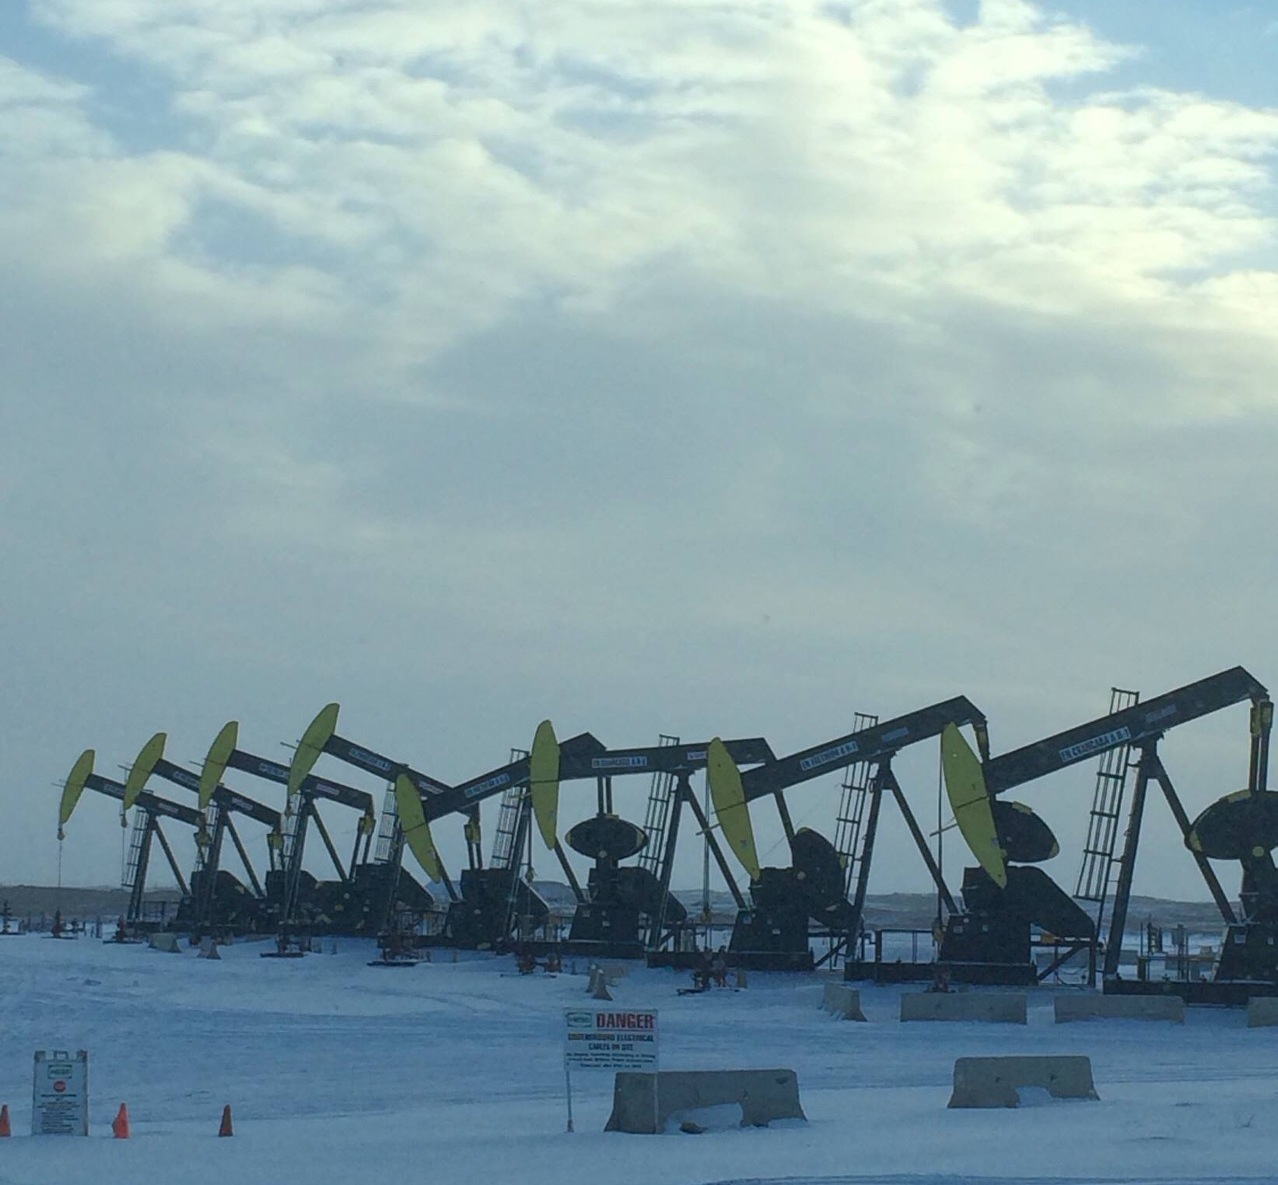
I’ve been going through a backlog of energy articles that I haven’t had opportunity to comment on before. A great article last fall from The Million Dollar Way prompted me to look at what has happened to oil output since prices collapsed.
10/14/15 – The Million Dollar Way – Wednesday, October 14, 2015 – Part IV; Blue Skies – Article is from October. The underlying point stands. Look how little the monthly output has changed even though drilling activity has shrunk.
Here are some stats mentioned for October 15 with prior year numbers:
- 67 current – 190 year ago – working drilling rigs.
- About 1000 DUCs currently (Drilled and UnCompleted, meaning awaiting fracking) – a year ago the concept did not exist – this is the number of wells that have been drilled but have not been fracked. As soon as prices rise a bit, these wells can be completed and start producing in short order. Sort of like unassembled inventory on the shelf, just waiting for a worthwhile price to assemble everything to get it on the market.
- Currently producers are choking back initial output to spread it over a longer period of time while a year ago production was wide open as fast as you can go.
- About 150 now – 300 a year ago – new oil permits per month.
So production has collapsed, right?
That must be the case because so many people have been saying for years that the only way production is stable is because of the massive amounts of new wells drilled every month. For as long as I have been blogging on the Bakken, I have been reading that production will collapse the month there is not a huge number of wells brought online.
Check out these output numbers for average daily production in the state, with a comparison of August to August, since that is the most current information available when the above post was written:
- 1,132,241 bopd – August 2014
- 1,187,631 bopd – August 2015
- 1,176,314 bopd – November 2015, the latest available
In spite of those drastic cutbacks in production, output increased 55,309 bopd in the year from August 2014 through August 2015, which is an increase of 4.9%. Since August 2015, production has dropped 11,317 bopd, or 0.95%.
From August 2014 through November 2015 production increased 44,073 bopd, or 3.9%.
OPEC intended to cause a dramatic drop in drilling activity. I seriously doubt they were expecting output to go up a bit.
Perhaps you think August is not a good cut off. Okay, let’s look at the change from the highest output to most current. Here’s the info since then:
- 1,227,529 – December 2014, high point of production output
- 1,176,314 – November 2015, latest available
- 51,215 – decline from highest output level
- 4.2% percent – decline from highest monthly output through latest data available
Let’s look at it from another direction. What has happened since prices started to collapse?
According to the data released in the monthly Director’s Cut, the high point of oil price in North Dakota was June 2014, when it averaged $90.03 per barrel. In November 2015 the price is $32.16. Most recent report indicates in January 2016 the price was $20.
So what has happened in production since the high point of oil prices? Check it out:
- 1,092,760 – average daily output in June 2014, when oil was at its highest point
- 1,176,314 – November 2015, latest available
- 83,554 – increase in daily output since high point for oil prices
- 7.6% percent – increase in daily output from month with highest price through latest data available
In a year and a half of collapsing prices, production has increased around 8%. That is not even close to what OPEC, I mean Saudi Arabia, had in mind.
Eventually production will drop. The drop will eventually be substantial. I take the risk of posting this before release of the February report disclosing the December production information. That info will be released later today or tomorrow.
