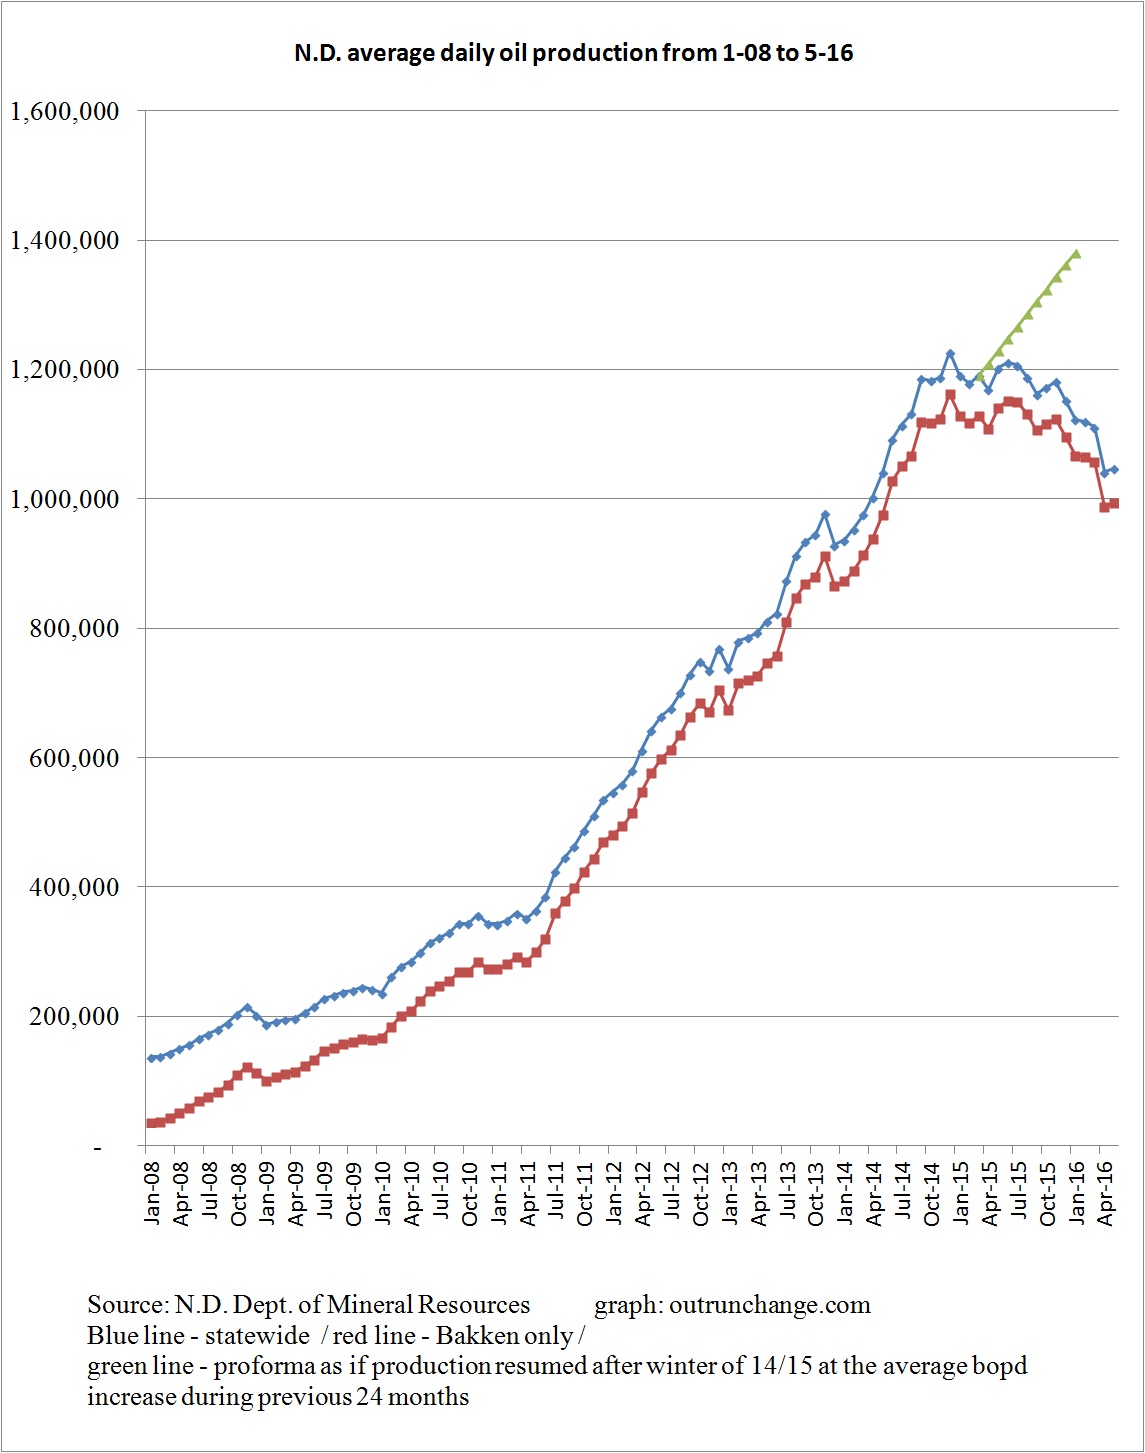
Oil production in North Dakota dropped about 6.3% in April and recovered a little in May, increasing about 0.5%. Here is the average daily production for last three months:
- 1,111,544 – March
- 1,041,981 – April
- 1,047,364 – May
Here are a few graphs that show the picture:
- Average production by month statewide and Bakken only since 2008 is shown at the top of this post
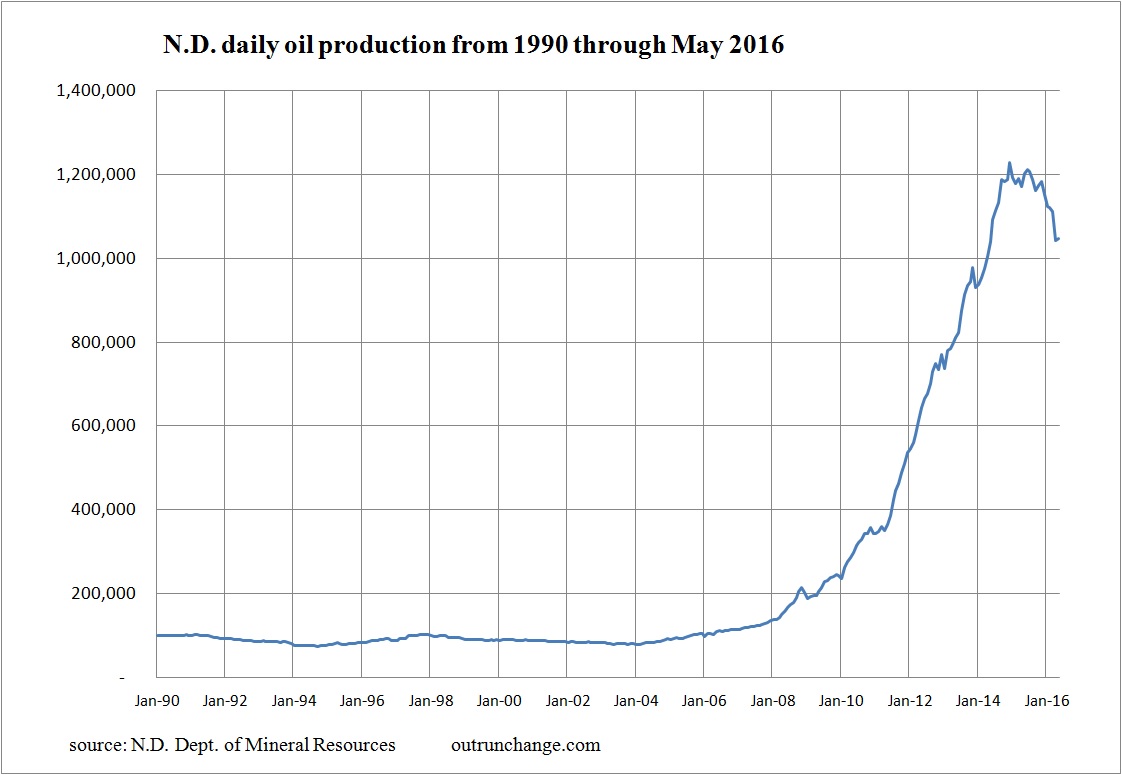
- Average production for the state by month since 1990
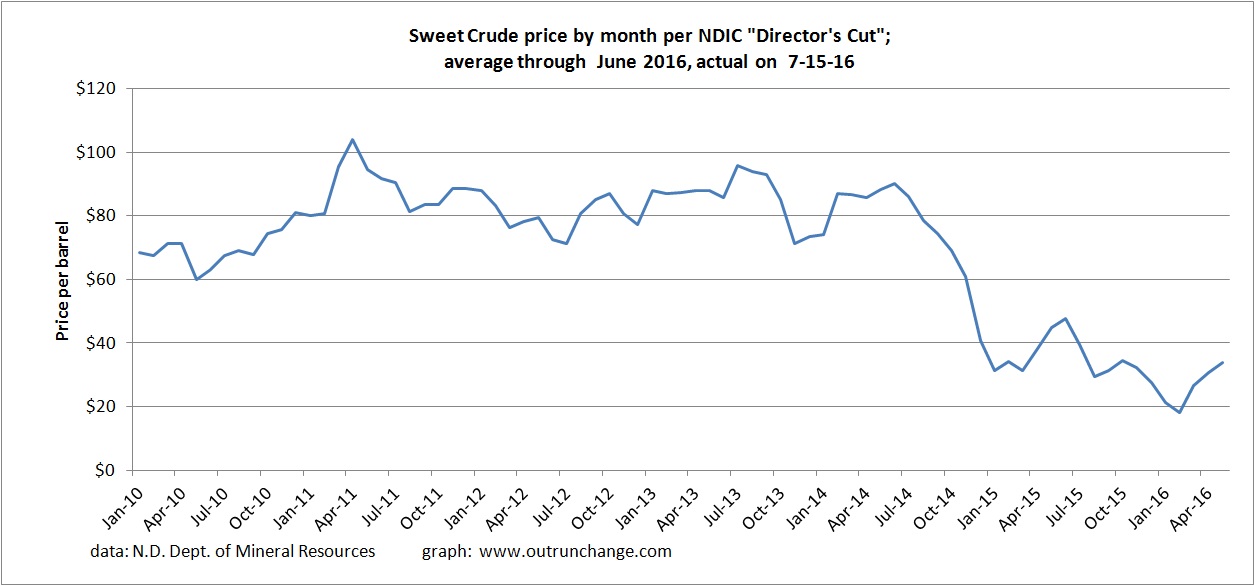
- Crude prices by month, which shows a modest recovery
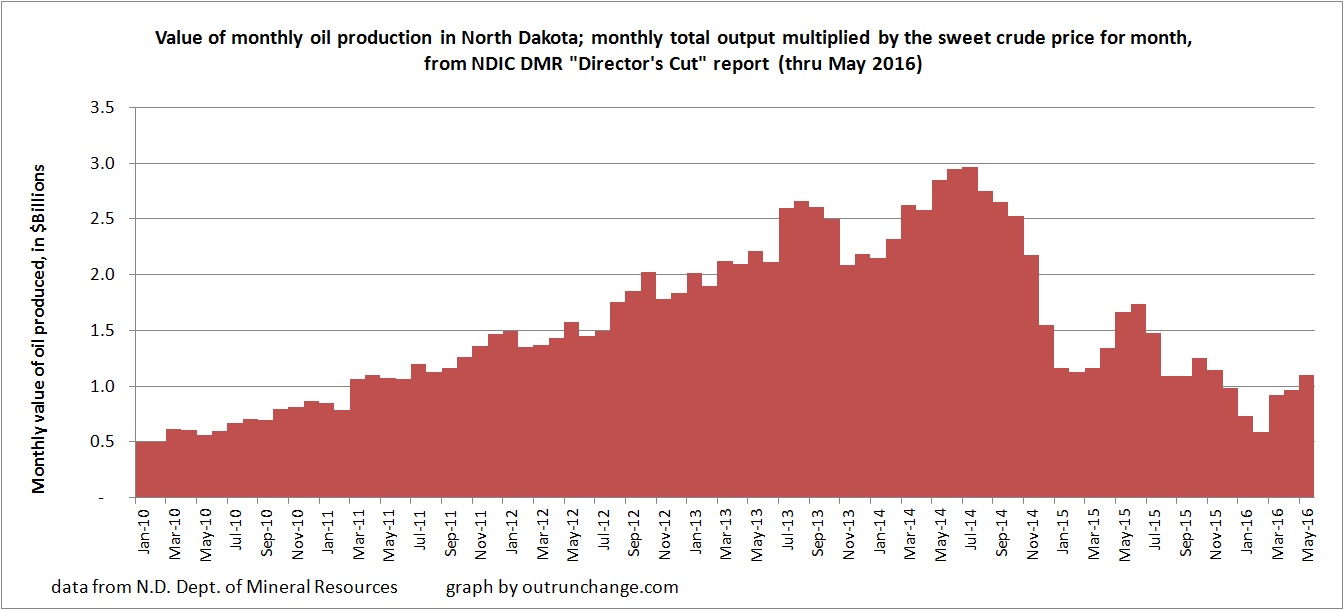
- Value of monthly production, which show a faint whiff of a hint in the air that maybe production is coming back to life
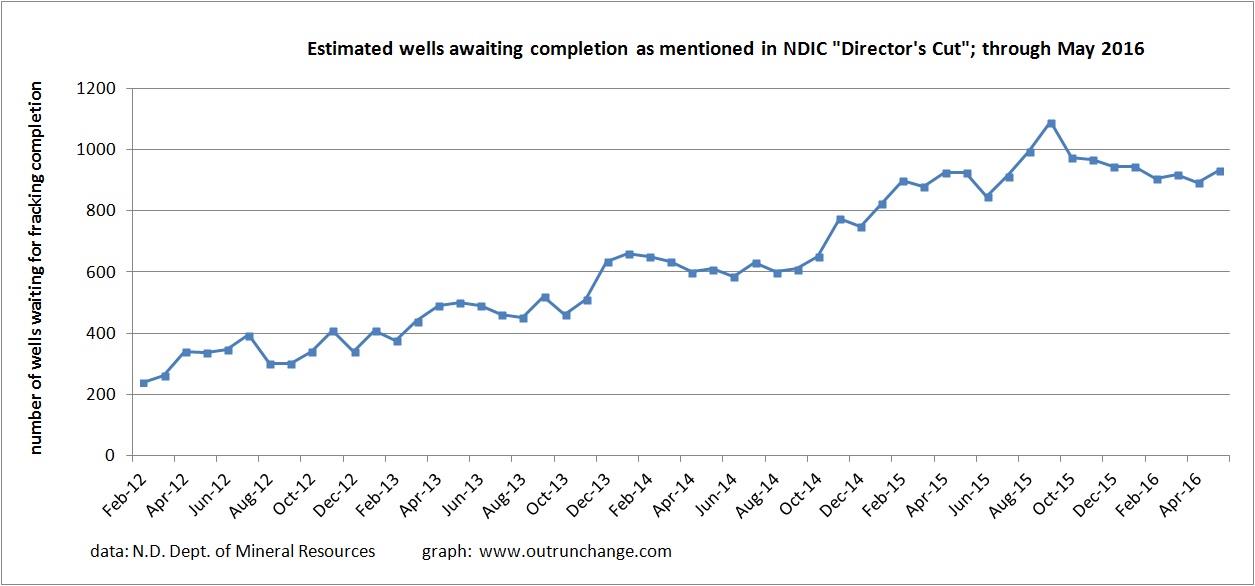
- Fracklog, which is the number of wells drilled to depth but awaiting fracking before production may begin
