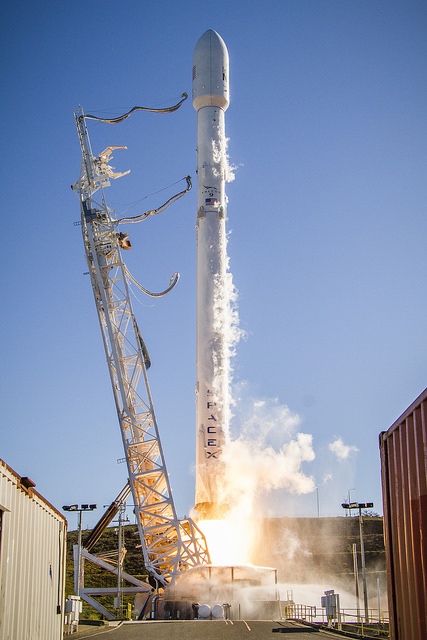
Behind the Black has tallied the number of space launches by country and by US company, by year from 1998 through 2016.
Mr. Zimmerman provides the tally at Launch industry trends, based on recent history on 1/11. He provides more observations on the trends in the January 13, 2017 Zimmerman/Batchelor podcast.
For a more overall view (and under fair use) I added up the launches from 1998 through 2006 and then from 2007 through 2016. I chose a break of 2007 because that is when Lockheed Martin and Boeing formed their joint venture, United Launch Alliance. Here are the long-term trends:
| source | 98 – 06 | 07 – 16 |
| US govn | 52 | 19 |
| Lockheed Martin | 50 | 0 |
| Boeing | 71 | 0 |
| ULA | 0 | 114 |
| Orbital ATK | 30 | 23 |
| Space X | 1 | 32 |
| Virgin Galactic | 0 | 0 |
| Rocket Lab | 0 | 0 |
| Neptune | 0 | 0 |
| US total | 204 | 188 |
| China | 47 | 144 |
| Russia | 254 | 288 |
| Europe | 70 | 82 |
| India | 9 | 34 |
| Japan | 19 | 29 |
| Iran | 0 | 4 |
| Israel | 3 | 4 |
| Brazil | 1 | 0 |
| South Korea | 0 | 3 |
| North Korea | 0 | 3 |
| total | 607 | 779 |
Here are just a few of the many things I learned from the detail:
The US government hasn’t had any launches since 2011. The only scheduled launches are SLS in 2018 and then a follow on SLS launch many years later if NASA can persuade Congress to provide massive additional funding.
In the US, all launches are provided by private sector companies who have their own platforms. Mr. Zimmerman points out in the podcast that in other countries, all of those launches were from the national space agency.
China has greatly expanded their launch schedule since 2010.
Russia’s schedule has been in decline for two years.
Very cool. For more info, check out the web article. For even more analysis, check out the podcast.