
Let’s look at some longer term graphs of oil production in North Dakota and the value of that production. Here is a view of the annual oil production in the state:
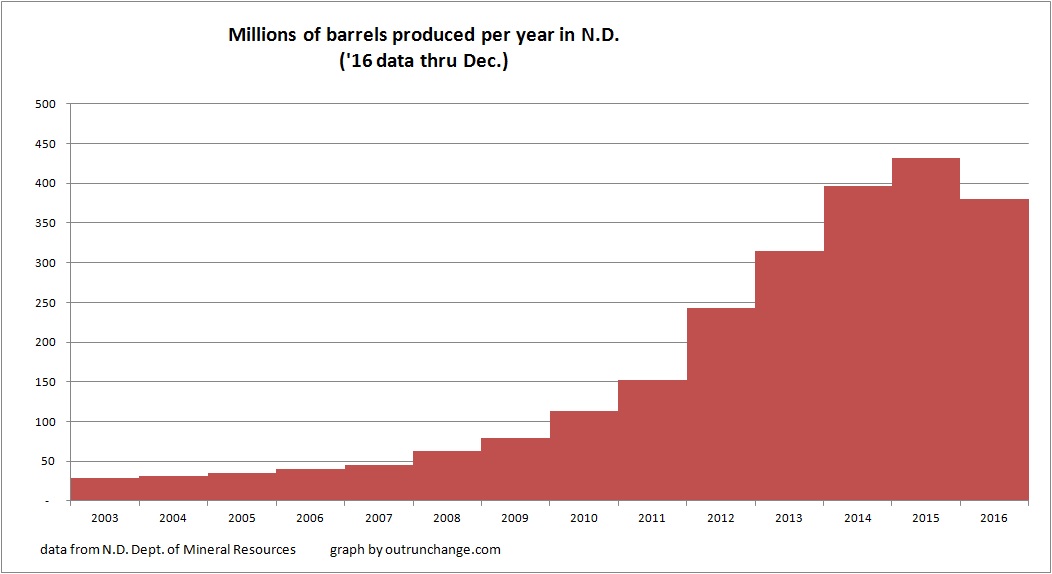
The fascinating insight from that graph is production did not drop in 2015.
Actually, production increased from 396.6M barrels in 2014 to 432.2M barrels in 2015.
Production dropped to 380.3M barrels in 2016, but that is only a decline of 51.82M, or 12.0%.
The value of production collapsed, because of the drop in price of oil, which was caused by OPEC as an effort to take out the U.S. shale producers.
Look at the monthly value of oil production, which I estimated using the average sweet price in the state, as provided by the state regulator:
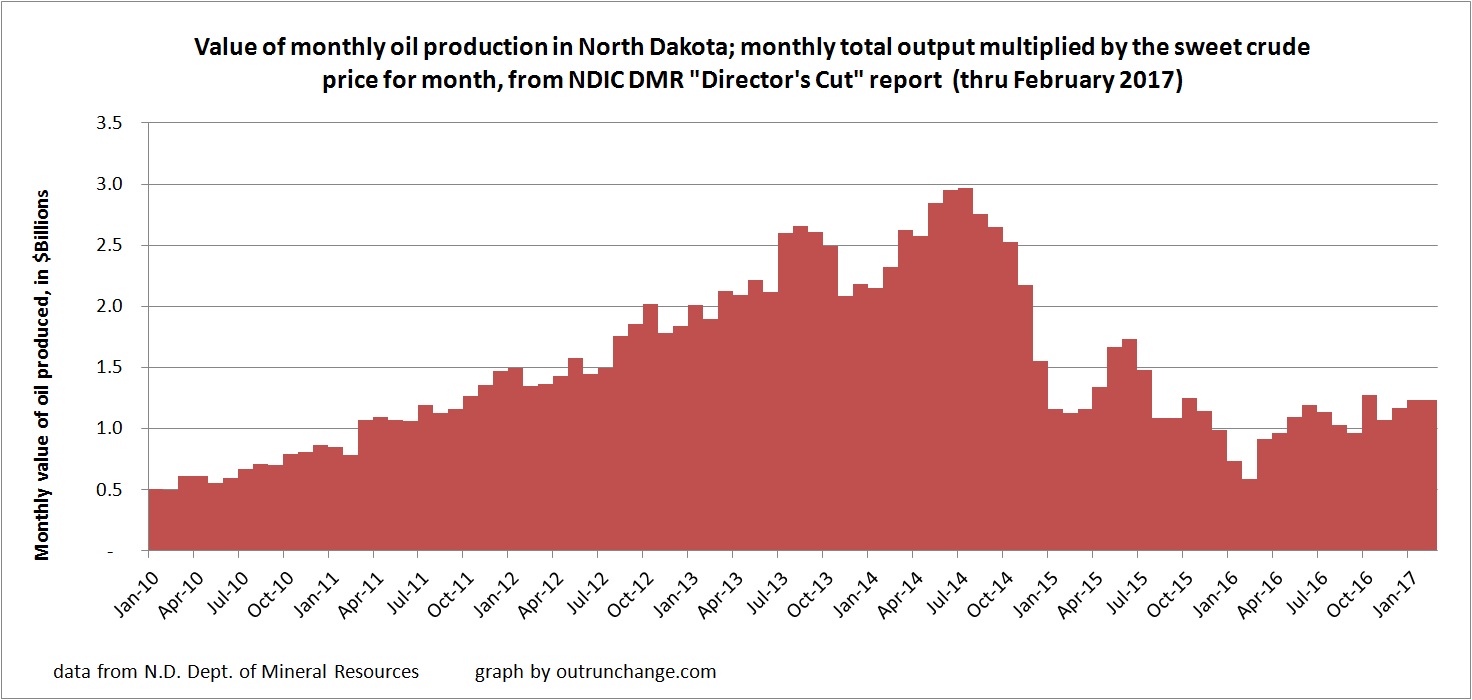
The rapid drop in value is quite evident.
A slow recover in recent months is visible. That includes a drop in production from 2014/2015 combined with slowly recovering prices.
For an annual view of the value of production, consider:
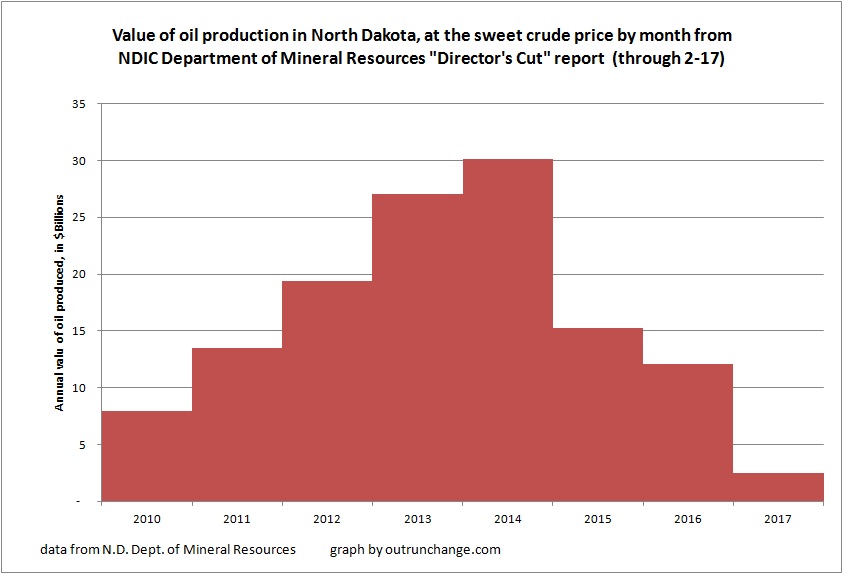
This shows how much the value of production collapsed in 2015. Keep in mind the 2017 data reflects only two months.
Oh, keep in mind that ten years ago, essentially none of that oil could have been recovered. That’s somewhere around $150 or $180 billion dollars worth of oil we would have otherwise imported from OPEC.