Yesterday’s post described the 2.4% increase in North Dakota oil production. Here are a few more graphs to tell the story.
Here is the average sweet crude price in the state by month:

Oil prices in the state have been edging up for quite a few months. The recovery in March through June 2016 is quite noticeable.
I expect that in a few months DAPL will narrow the spread from West Texas Intermediate and the price in North Dakota will go up even more.
What is the value of monthly production?
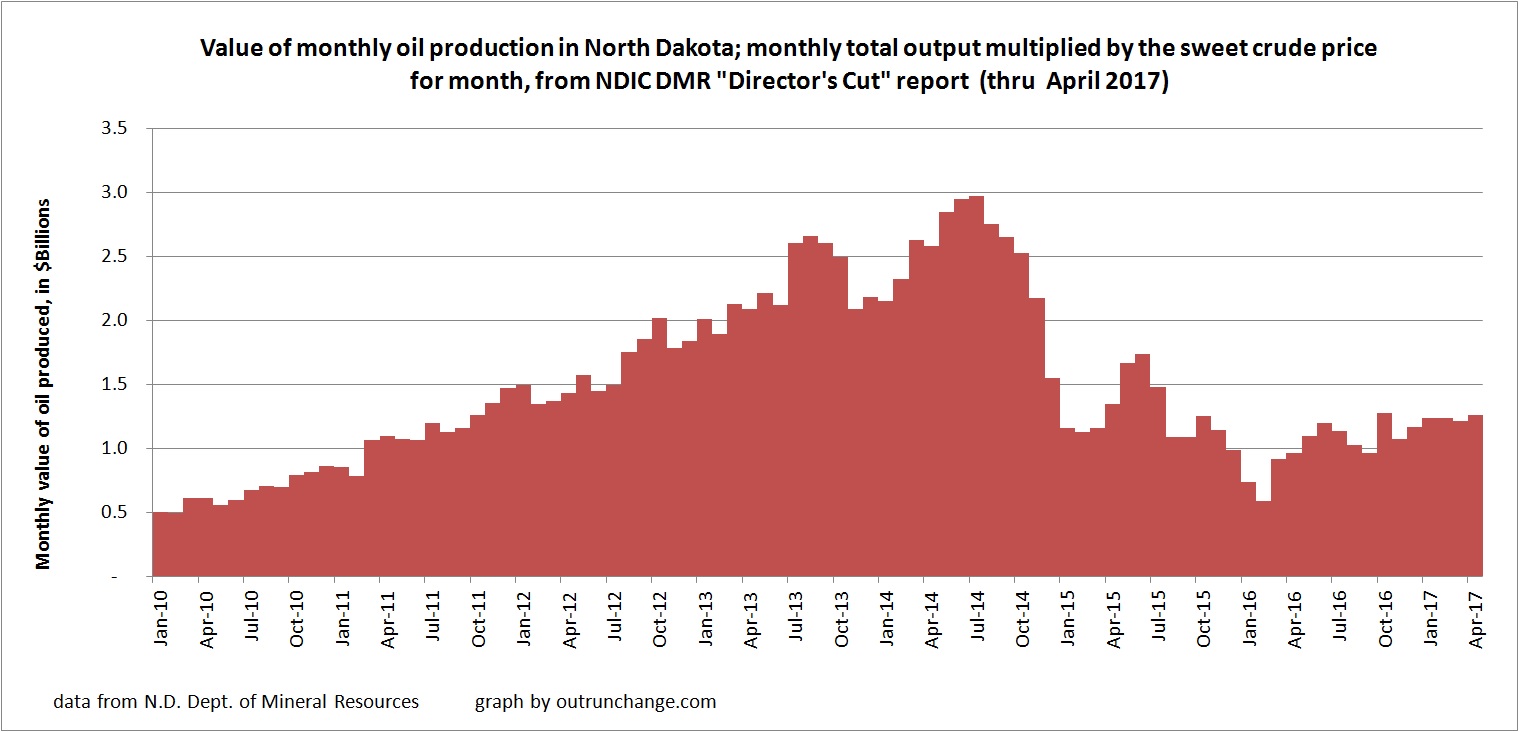
The increasing prices and increasing production mean the gross revenue from production is also going up. You can see the income amount rising in the graph. There was a dramatic jump in the spring and a respectable increases since the summer.
What does the fracklog look like?

There continues to be a healthy backlog of wells waiting for fracking. As soon as the frack work is done, those wells can start producing lots and lots of money. From another perspective, that is around 800 wells that can start producing really fast if there were to be a price jump that is expected to last several quarters out.
Lots of oil inventory on the shelf. Very cool.
Also available at http://ccbr.iedtexas.org/research/