
Before showing the average daily production, annual production, and value of that production, just a note on December 2017 production.
Average daily production dropped from 1,196,976 bopd (revised) in November to 1,181,319 bopd (preliminary) in December, a decline of 15,657 bopd, or 1.31%.
Here is what the average daily production by year looks like. Notice the recovery in 2017?
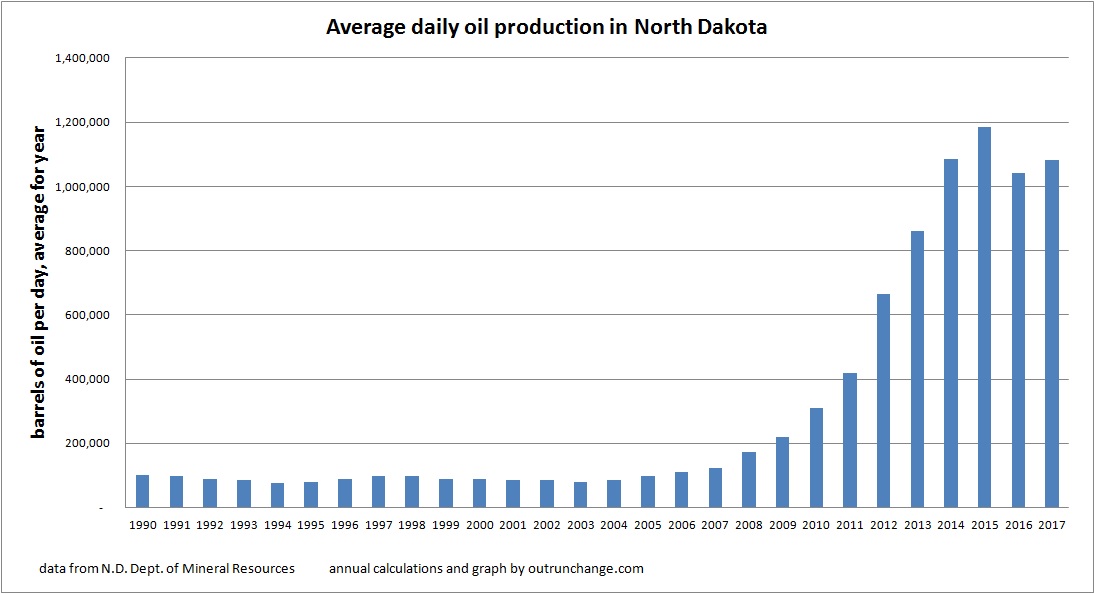
The annual data for the last decade:
| year | average daily production |
| 2007 | 123,621 |
| 2008 | 171,999 |
| 2009 | 218,432 |
| 2010 | 309,763 |
| 2011 | 418,917 |
| 2012 | 665,236 |
| 2013 | 861,296 |
| 2014 | 1,086,554 |
| 2015 | 1,184,009 |
| 2016 | 1,039,203 |
| 2017 | 1,081,379 |
What is the total annual production? Check this out:
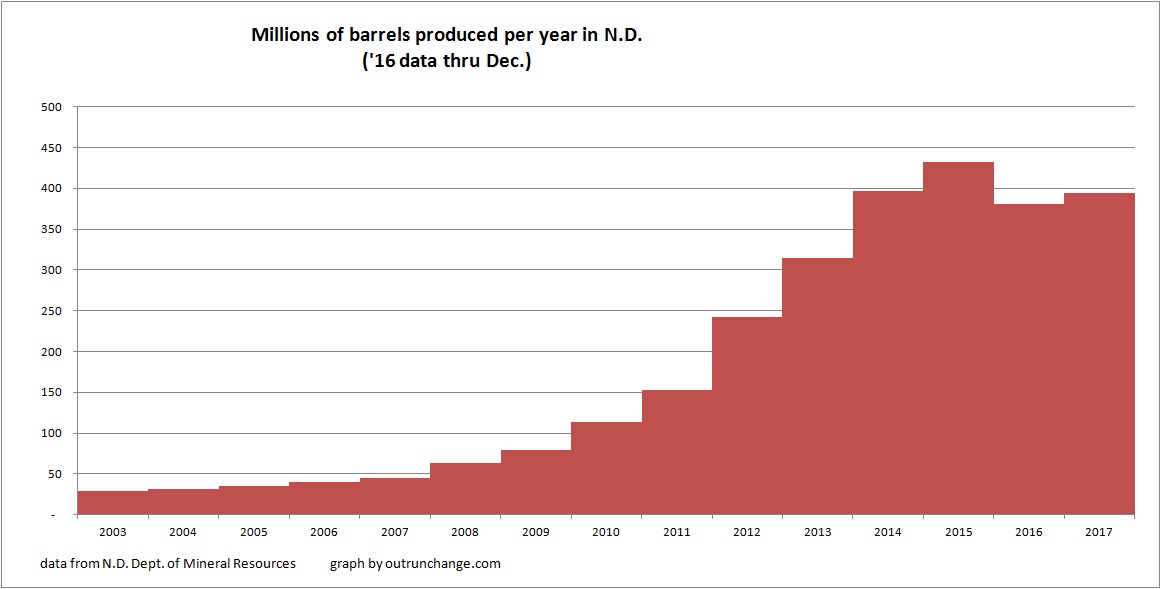
The data:
| year | barrels for year |
| 2007 | 45,121,798 |
| 2008 | 62,779,796 |
| 2009 | 79,727,666 |
| 2010 | 113,063,565 |
| 2011 | 152,904,590 |
| 2012 | 242,811,286 |
| 2013 | 314,373,123 |
| 2014 | 396,592,107 |
| 2015 | 432,163,396 |
| 2016 | 380,348,229 |
| 2017 | 394,703,340 |
How about if we multiply the monthly sweet crude price as reported in the Director’s Cut by the monthly production? Here’s what I calculate the total value of oil production in North Dakota looks like for the last few years:
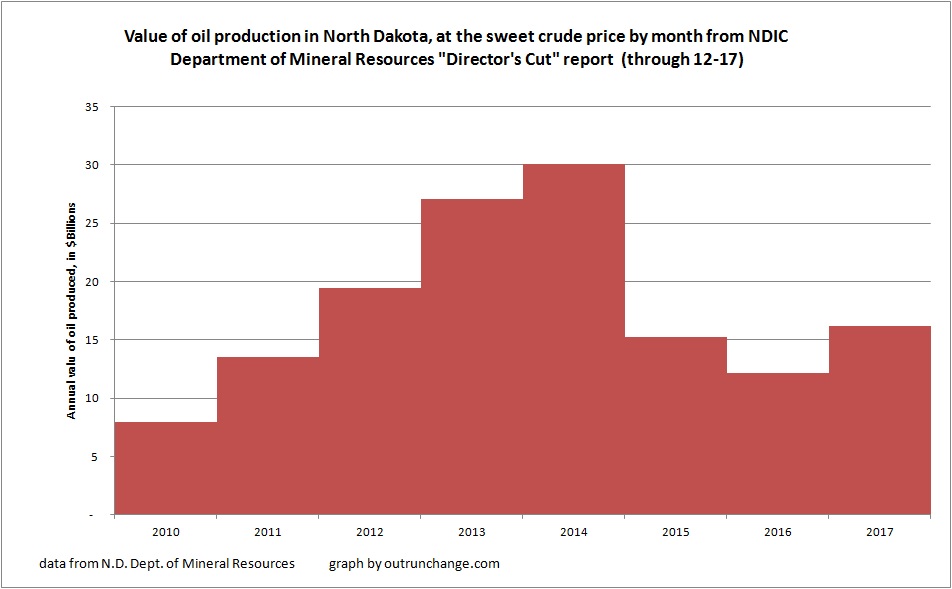
| year | est value of prod. In $billions |
| 2010 | 7.92 |
| 2011 | 13.50 |
| 2012 | 19.40 |
| 2013 | 27.08 |
| 2014 | 30.10 |
| 2015 | 15.22 |
| 2016 | 12.12 |
| 2017 | 16.20 |
(Oh yeah, what peak oil?)