Let’s take a look at what hyperinflation does to the value of currency.
Using the Bolivares Fuertes (Bv.f) currency, we can construct a visualization of hyperinflation.
Previous posts describe the horrid inflation suffered by the people in Venezuela:
- 3/6/21 – This is hyperinflation, Venezuela edition. Courtesy of socialism, as always. Part 1.
- 3/7/21 – This is hyperinflation, Venezuela edition. Courtesy of socialism, as usual. Part 2.
- 3/8/21 – This is hyperinflation, Venezuela edition. Courtesy of socialism, of course. Part 3
- 3/12/21 – This is hyperinflation, Venezuela edition. Expected devastation from socialism. Part 4.
- 3/26/21 (today’s post) – Illustration of Venezuelan hyperinflation from 2012 through 2018. Part 5.
Imagine a small basket of a few items that would cost $1. The following illustrations are how many Bolivares fuerte it would take to buy that little basket.
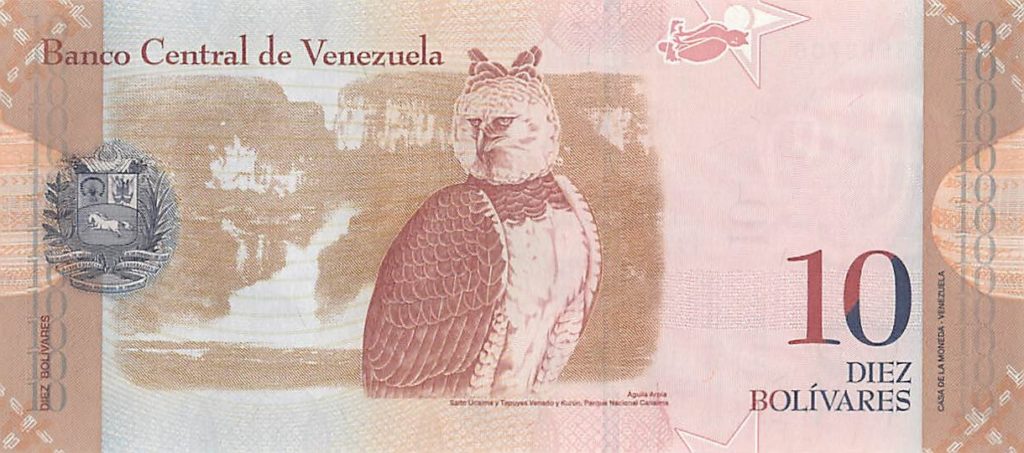
From 2010 and earlier up until August 2012, 10 Bv.f could convert to US $1. That was before the inflation took off.
Value to US$1 in 8/12 and earlier:
What happened in the next six months?
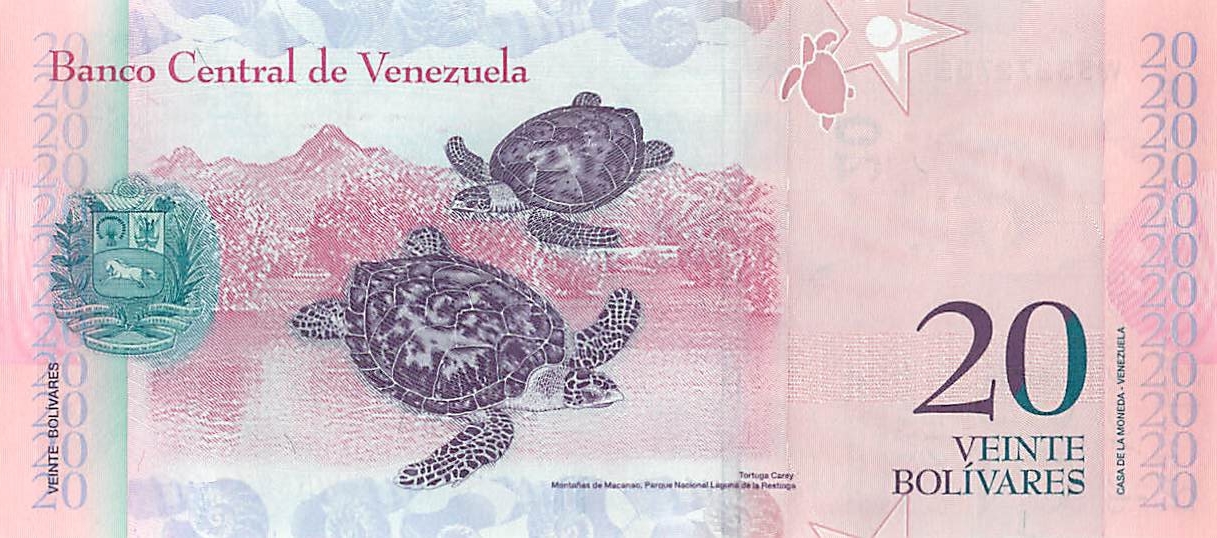
In 2/13, six months later, 20 Bolivares were needed to buy $1. Twice as many.
2/13:
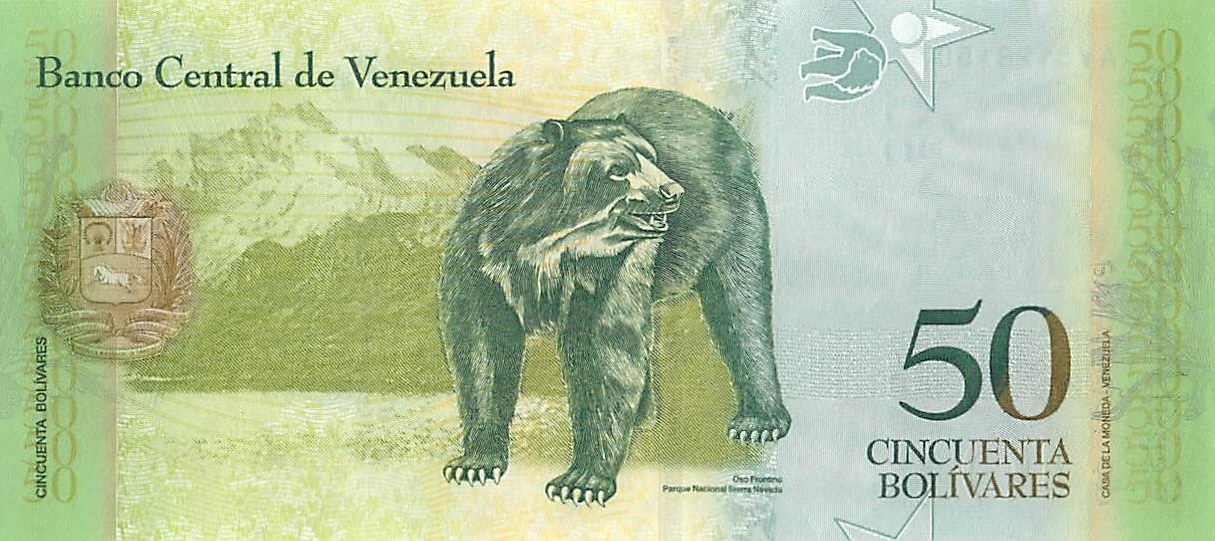
Eight months later, in 10/13, it took 2.5 times again as much to buy the same $1 basket of stuff. That is five times as much as in 8/12.
10/13:
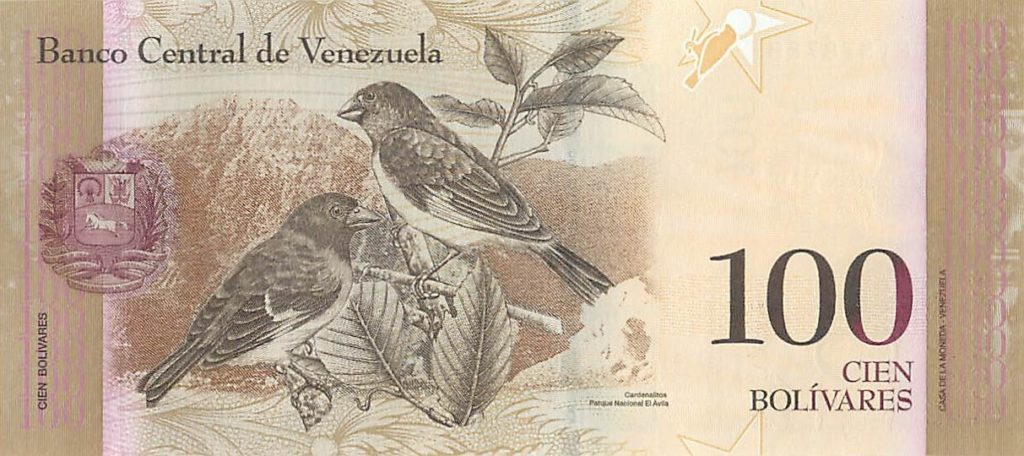
It took eleven more months to double the Bv.f to buy $1. In 9/14 exchange rate was 100:1
9/14:

In another 10 months, it took six times as much to buy $1.
7/15:

In another seven months, 2/16, the exchange rate almost doubled, to 1,000:1
2/16:

By 10/16, the exchange rate was at 1,500. Another month, 11/16, it more than doubled to 4,000:1. In nine months an increase from 1,000 to 4,000.
11/16:
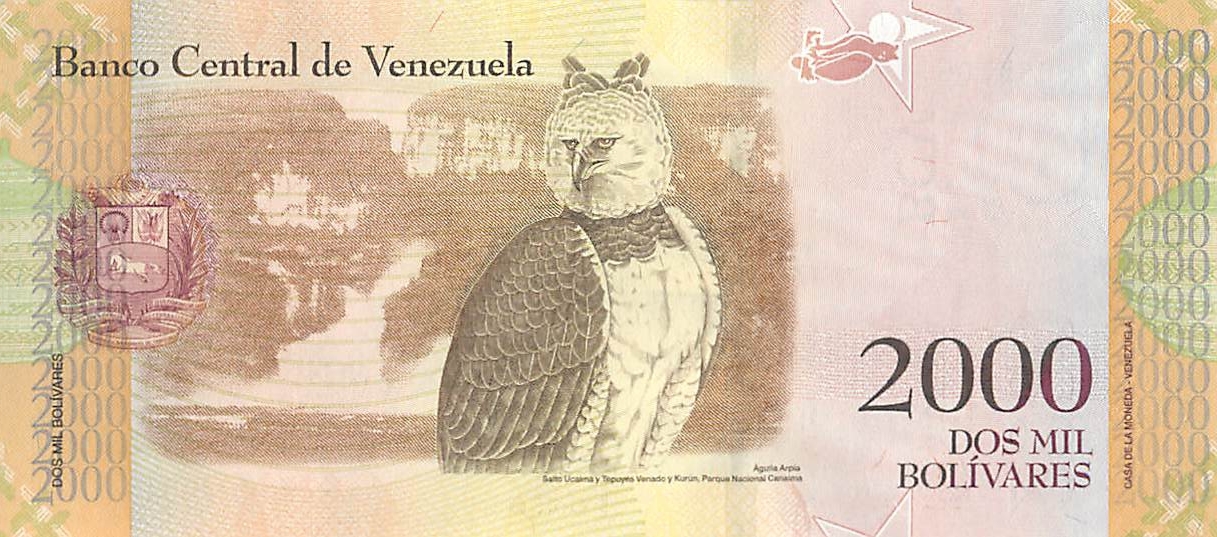
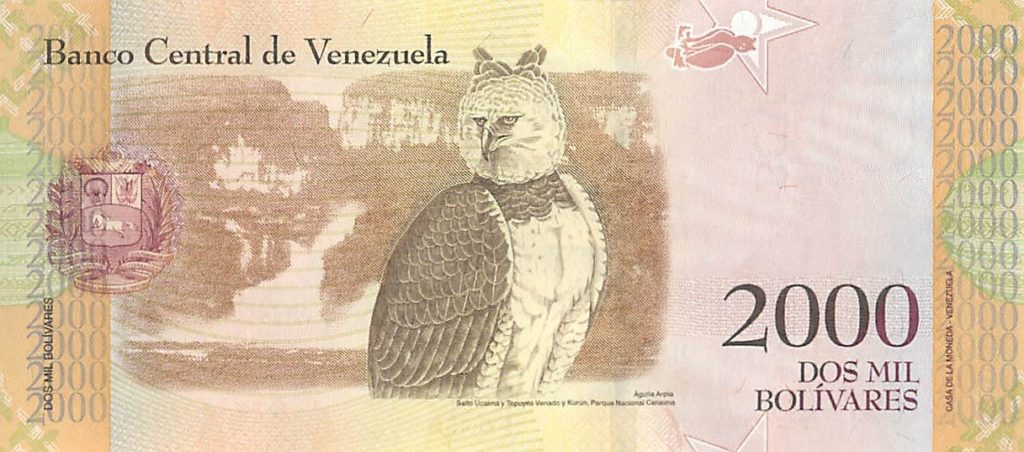
In another six months, 5/17, it took another 50% drop, with exchange rate at 6,000:1. The alternative to the following two bills would be a big stack of 600 bills of the 10 Bv.f denomination. 600. In about five years.
5/17:
In merely two months, to 7/17, the exchange rate deteriorated about double, to 11,000:1.
7/17:

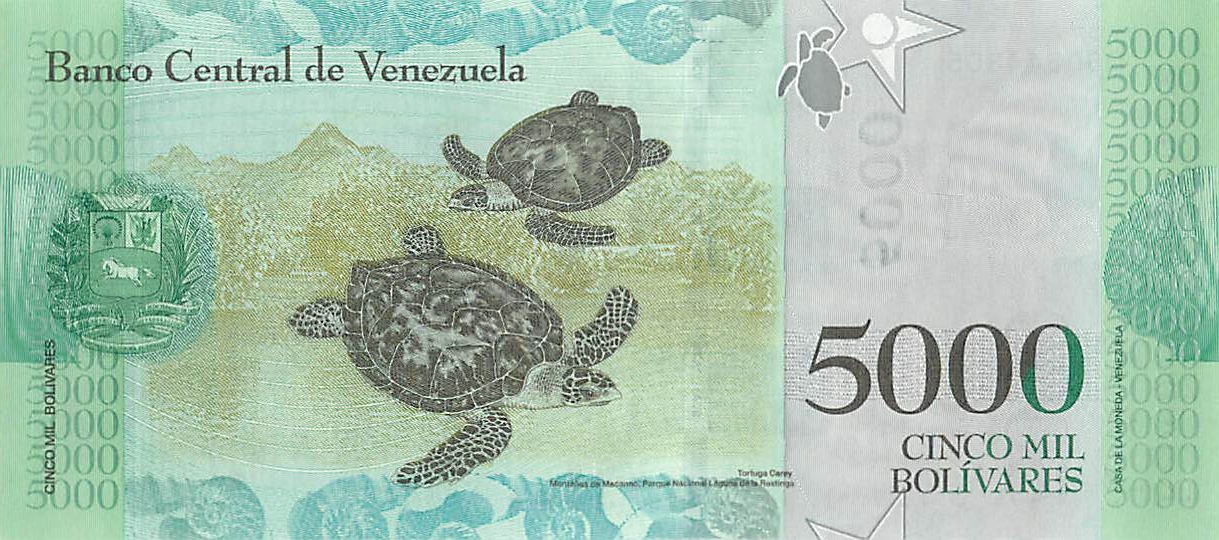
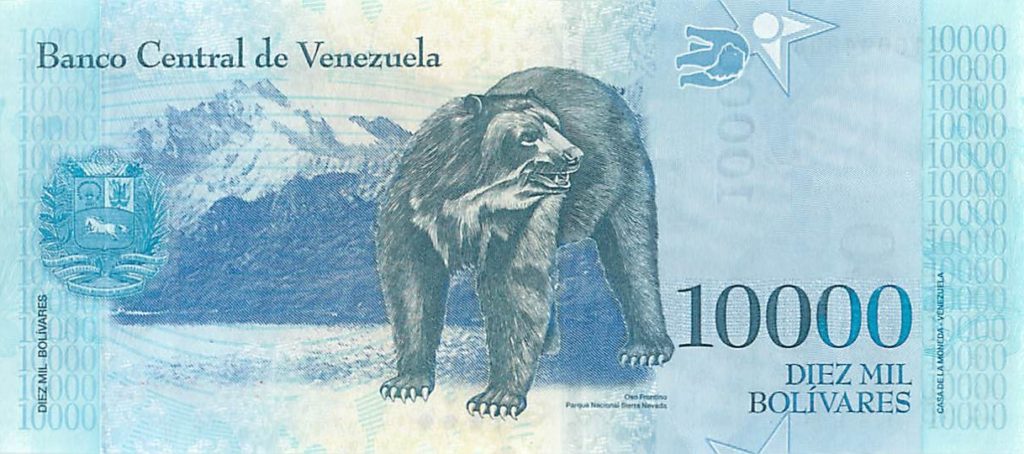
In two more months, 9/17, the exchange rate was 29,000:1. This is horrible enough that we can illustrate with a 20K and 10K note, keeping in mind there would be a 1,000 bill left over, or about 1/3 of a penny.
9/17:

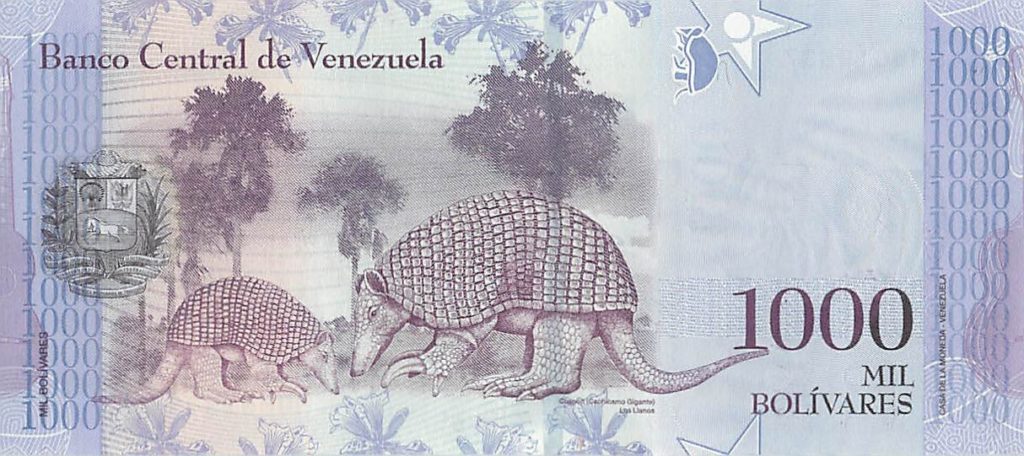
In merely 2 more months, in 11/17, the exchange rate accelerated to 97,000:1. So you could now use a 100,000 bill with 3,000 change. The change would be worth about one third of a cent.
11/17 (notice3 zeros dropped from the number):

In 4/18, another 5 months, it would take 6 of the 100,000 bills to buy a $1 basket of stuff.
In 8/18, another 4 months, it would take 59 of the 100K bills for a dollar, about 10 times as many.
By 12/18, merely 4 months, you would need 730 of the 100K bills for a dollar, over ten times as many. Exchange rate was 730,000,000:1.
If you want to see this devastating hyperinflation in terms of numbers, here is the list of the exchange rates visualized above:
| exchange | date | months |
| 10 | August-12 | |
| 20 | February-13 | 6 |
| 50 | October-13 | 8 |
| 100 | September-14 | 11 |
| 600 | July-15 | 10 |
| 1,000 | February-16 | 7 |
| 4,000 | November-16 | 9 |
| 6,000 | May-17 | 6 |
| 11,000 | July-17 | 2 |
| 29,000 | September-17 | 2 |
| 97,000 | November-17 | 2 |
| 621,000 | April-18 | 5 |
| 5,900,000 | August-18 | 4 |
| 73,000,000 | December-18 | 4 |