With a 45 day lag in reporting to allow data submission and collation, the production data for crude oil during May is now available for North Dakota.
The combined shocks of reduced demand for the pandemic and flooding the market by Saudi Arabia collapsed prices which then collapsed production. A glut of oil jammed the storage capacity for a while which further drove down the prices available to producers in North Dakota.
The impact on volume and value of production is staggering.
The graphs of production in this post demonstrate how rapidly a massive industry, like oil production across an entire state, can respond to price signals in a capitalist economy. That part is amazing to see.
May production data
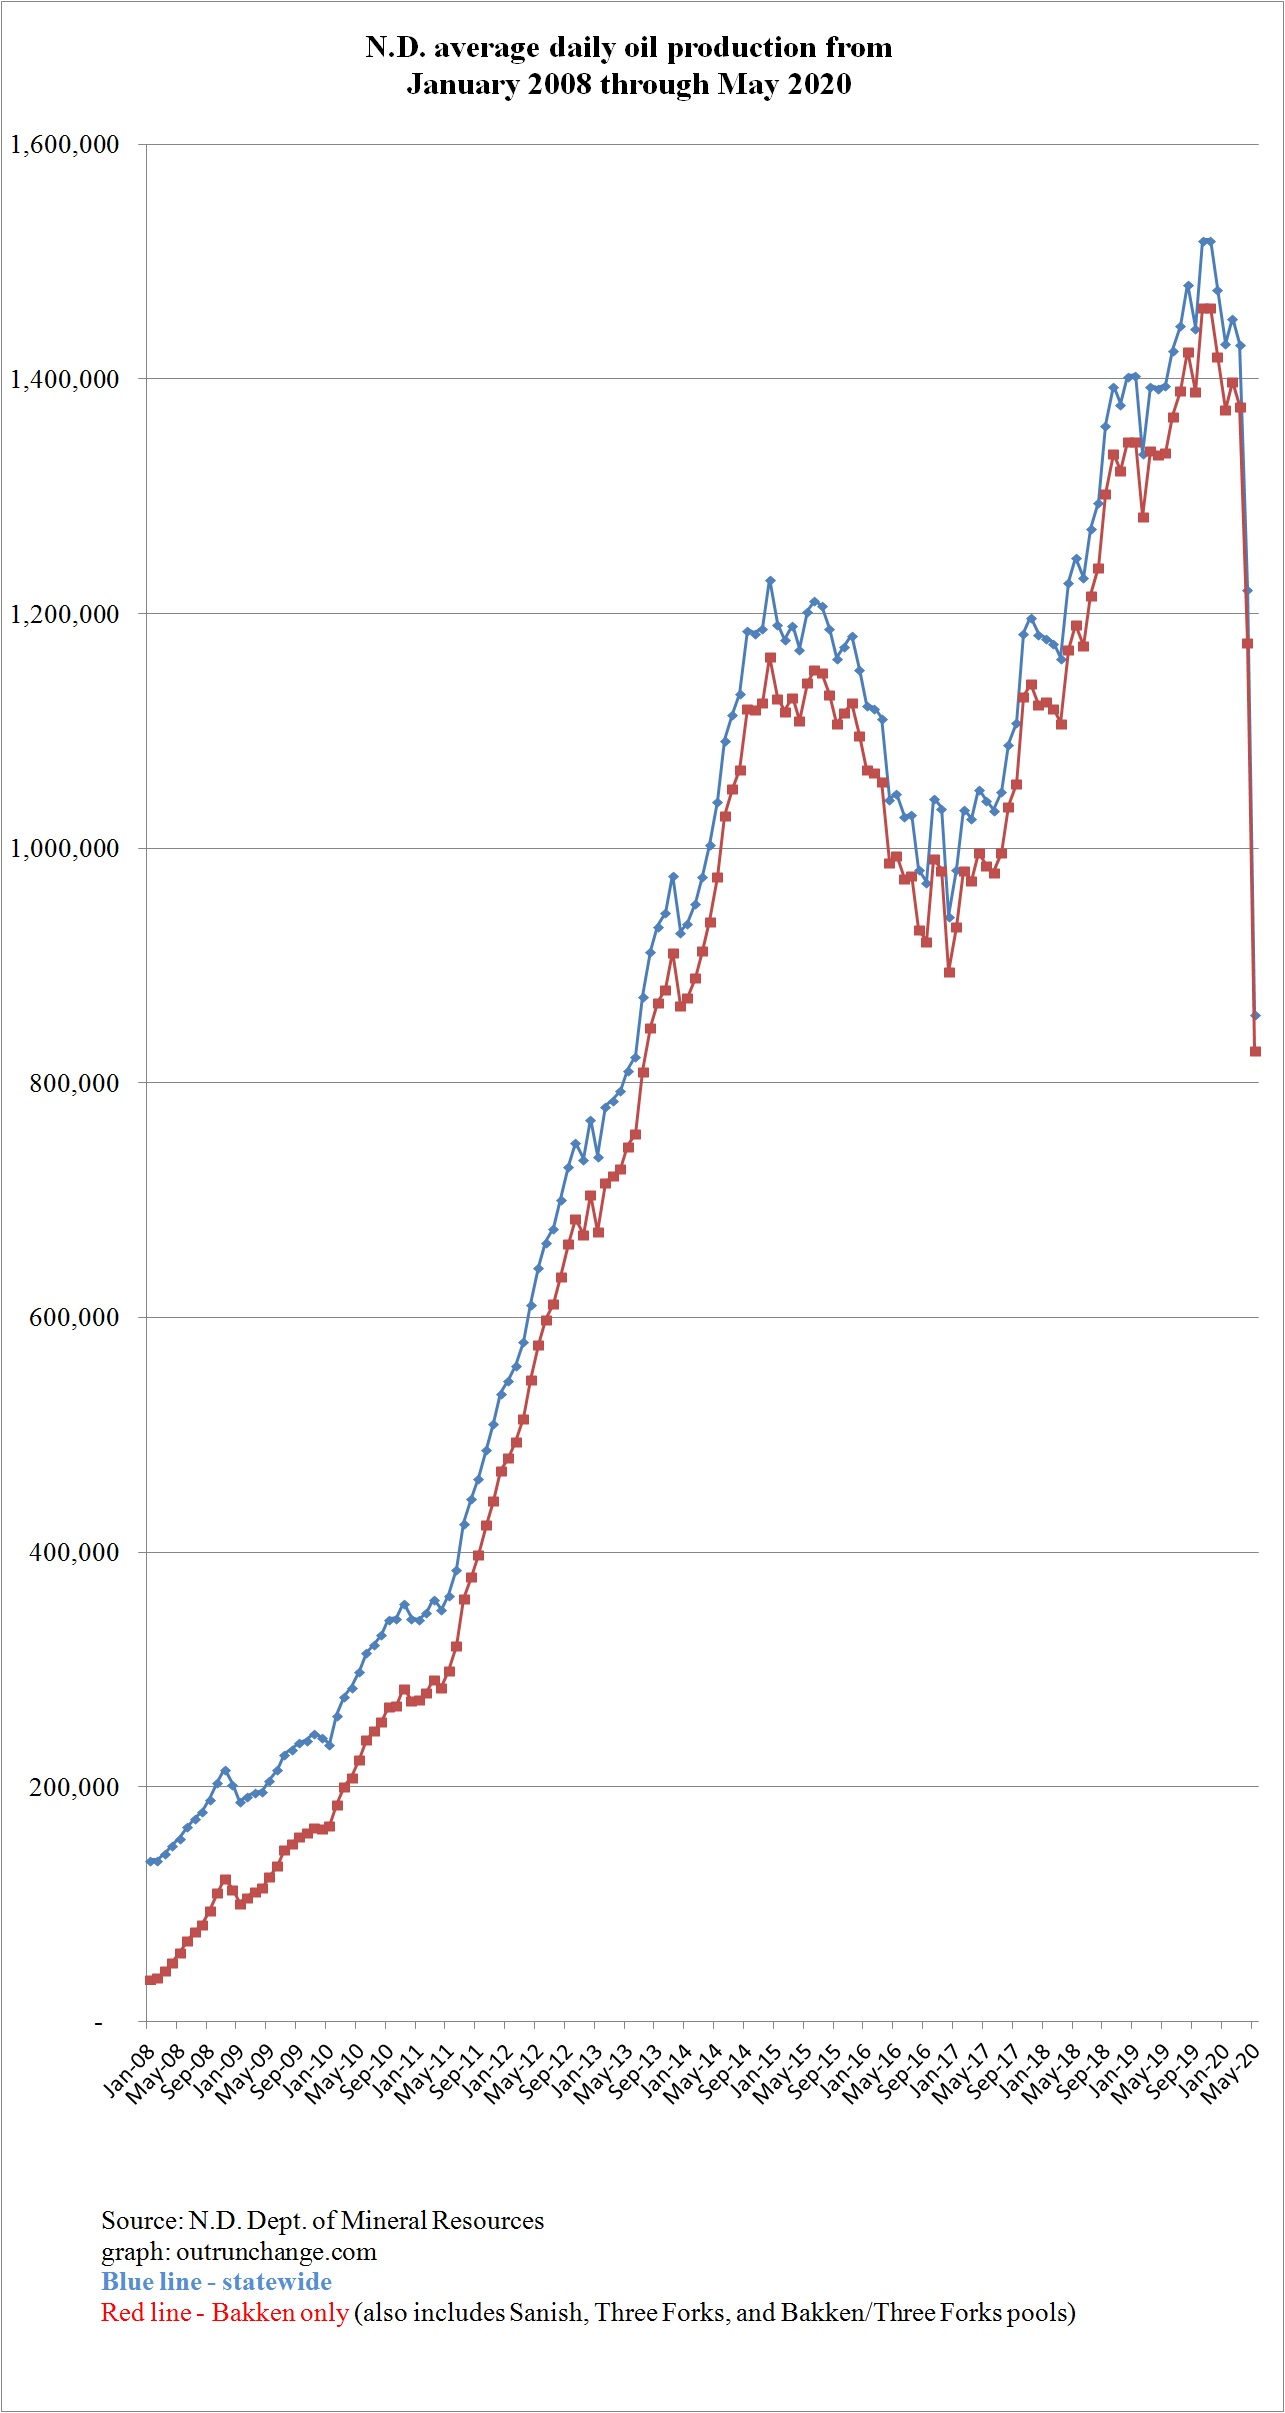
Crude oil production in the state dropped to 858,395 bopd (preliminary) in May. This is down 362,624 bopd from the revised April level of 1,221,019 bopd. The April production was down 209,353 bopd from March.
The average monthly production has dropped 660,637 bopd since the record high of 1,519,032 bopd in November 2019. That is a 43.5% drop from the high point.
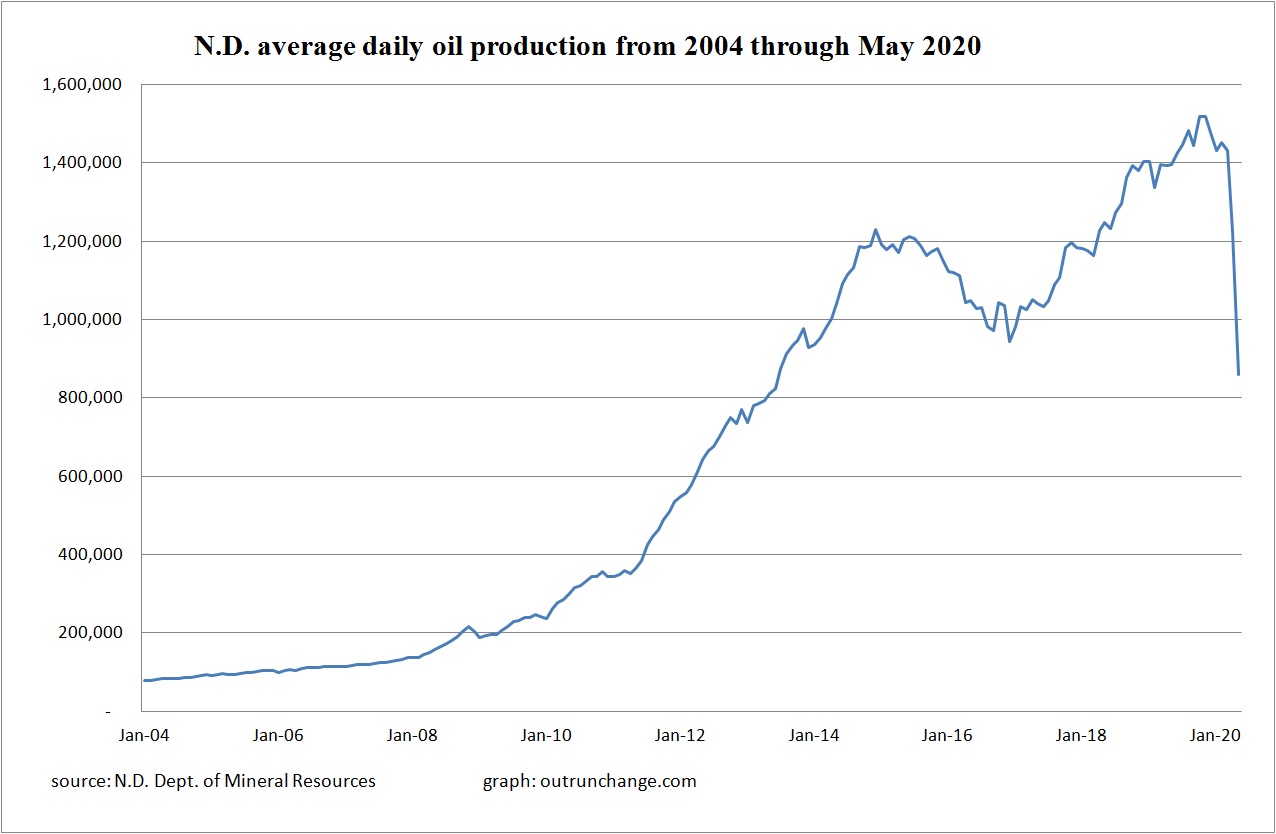
Graph at the top of this post shows the average monthly production in the state and for the Bakken fields. For a longer time perspective with just total production in the state check out:
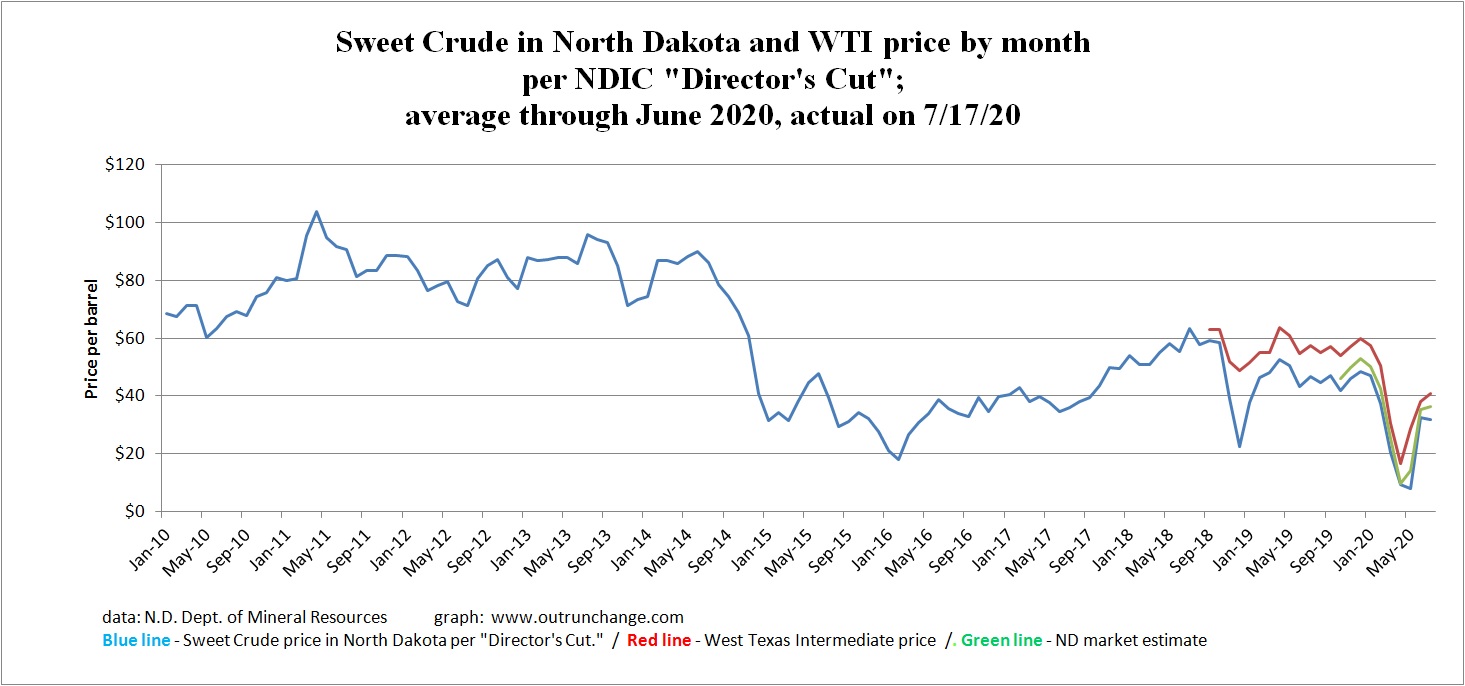
The price signal very clearly told producers to cut back. Look for the powerful signal for two months before prices recovered substantially:
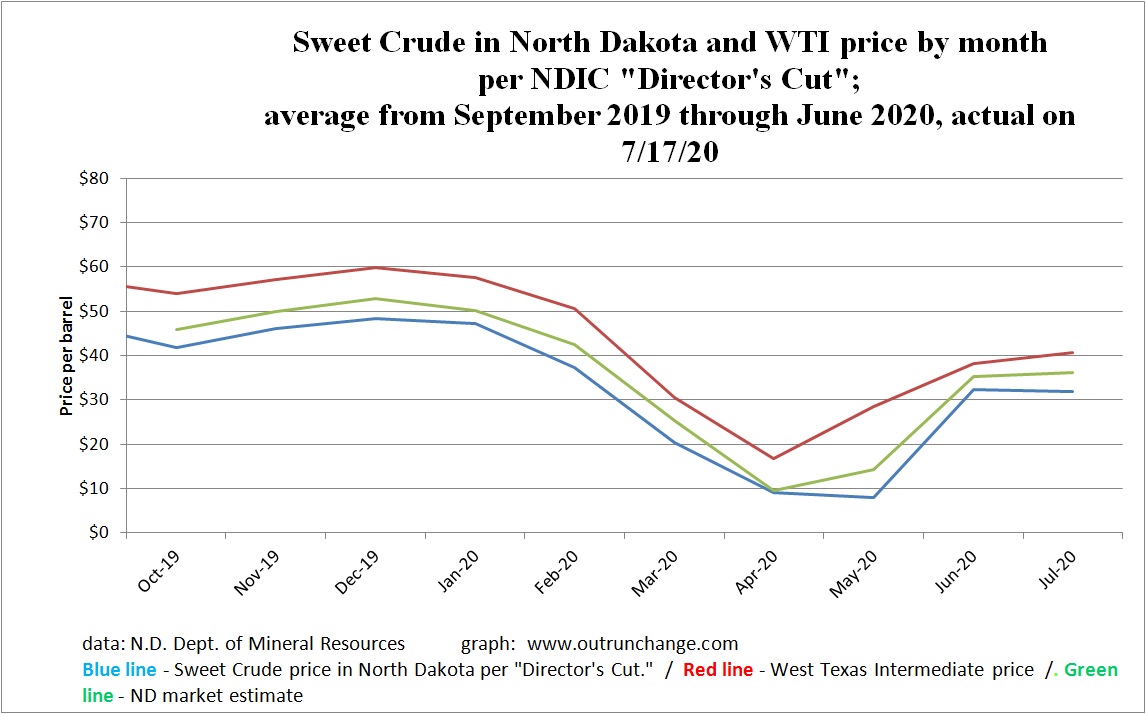
Looking at the price data since last fall shows the price signal even more clear. Look particularly for the bigger gap between West Texas Intermediate and the prices in North Dakota:
Next post will describe some of the underlying production information.


