OPEC asks US frackers to curtail production

Three more reasons OPEC is in distress. Eventually there will likely be 6 or 15 wells on that site. Photo by James Ulvog.

Pressures on OPEC continue.  Several recent articles point to OPEC’s request that the US cut back its oil production. Creating financial distress didn’t work to take out US producers, so OPEC will instead try asking frackers nicely to curtail production.

Anyone want to guess how that will turn out?

Another article explains that the reversal of austerity moves by Saudi Arabia is due to internal political maneuvering.

5/11 – CNN Money – OPEC to U.S.: Please don’t pump so much oil! – How do you think this will work: In their monthly report, OPEC said that all oil producers need to work together to reduce the oversupply (hint so they can all make more money) and dropped a strong hint that producers in the US should cut back production.

Yeah, that’s a great plan! OPEC can bank on that working.

5/12 – Daily Caller – Saudi Arabia Whines US Has Too Much Control Over World’s Oil – One commentator observes the Saudis have realized they don’t have as much control as they did a decade ago.

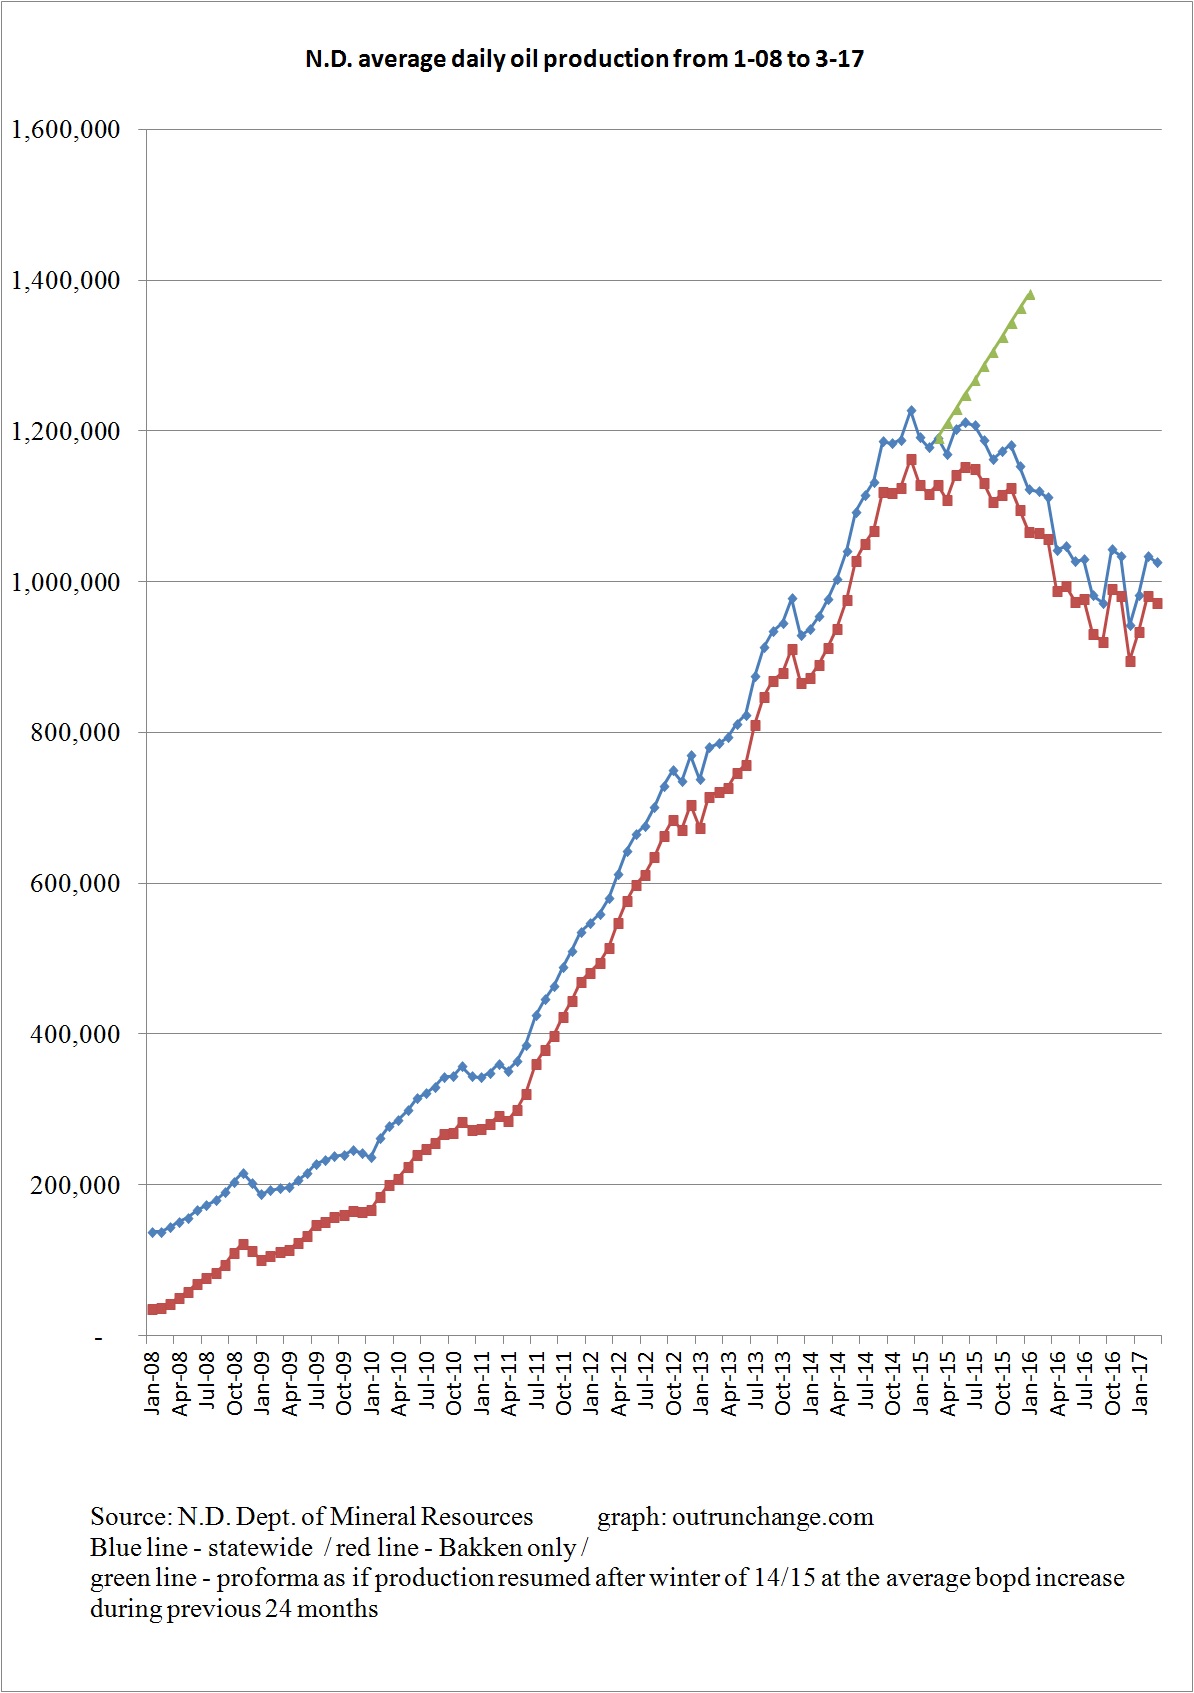
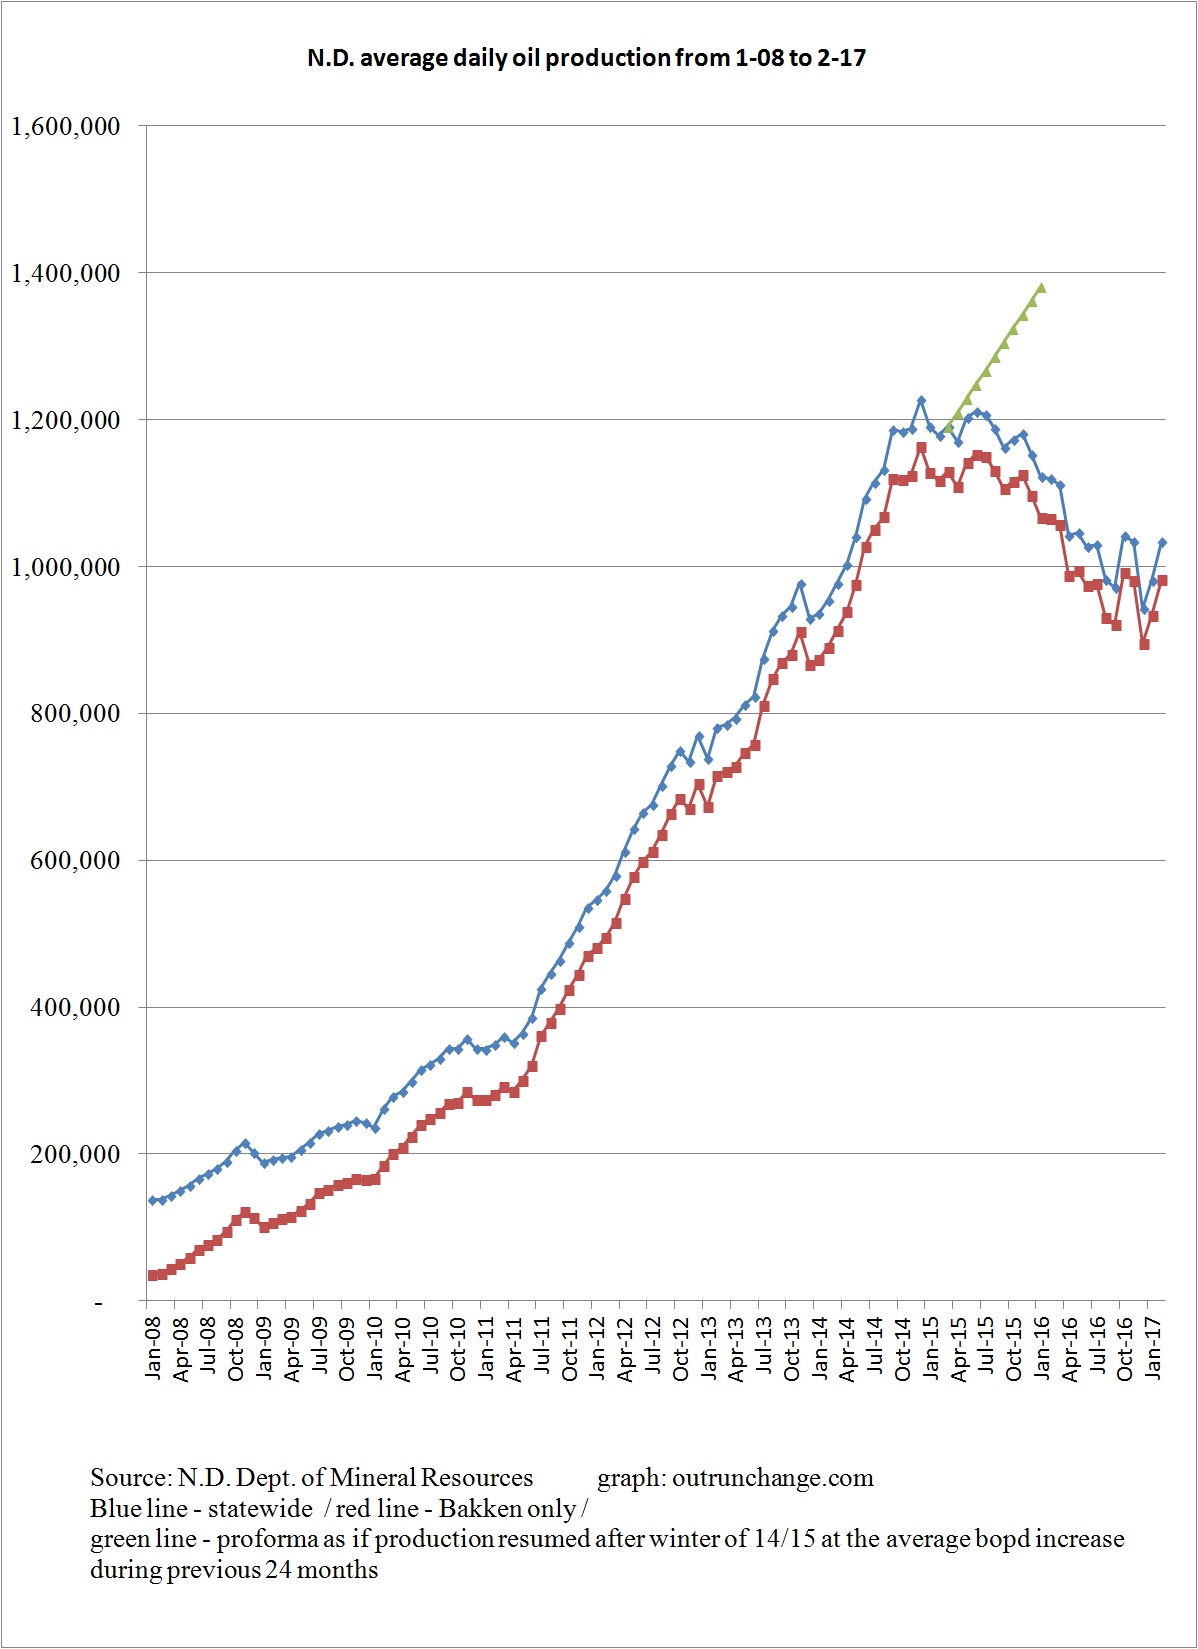
America imported 60% of its oil in 2007 but only 27% in 2014. That is a massive loss in market for OPEC.

There is a lot of pressure on Saudi Arabia, both internally and externally.

Continue reading “OPEC asks US frackers to curtail production”

North Dakota oil production steady in March ’17

Average daily oil production dropped 0.83% in March, from 1,034,248 bopd (revised) to 1,025,638 bopd (preliminary). Director’s report for the month is not out as of the time of posting this discussion. This month, I’ll just show two graphs of production:


Here is a longer term view:

Continue reading “North Dakota oil production steady in March ’17”

OPEC is still in a jam and a few of the reasons why.

14 wells on one pad. That would be 14 of the thousands of reasons OPEC is in distress. Photo by James Ulvog.

The scheduled production cuts from OPEC are nearing the expiration date as oil prices drop further. Why are they in such a difficult position? Photo above illustrates 12 specific things contributing to their discomfort.

Some articles describing their troubles and why the troubles won’t be going away anytime soon:

5/3/17 – Wall Street Journal – Oil Forecast to Fall Sharply if OPEC Doesn’t Extend Production Cuts – Article says the oil market has priced in an extension of the OPEC production cut. If correct, that means oil prices will fall if the production cut is not extended during meetings this month.

Article has a graph showing forecasts from 14 banks of their guesses on oil prices through the end of the year. For 4th quarter, the estimates range from mid-$40s to almost $70, with most of the estimates in the high $50s or very low $60s.

Article speculates that without an extension, price could drop into $40s.

5/5/17 – Bloomberg – OPEC Runs Out of Options as Bid to Boost Oil Price Fizzles – Article says the OPEC producers have kept to their agreed upon production cuts. That pushed prices up for a while but now prices are back to where they were when the cuts were announced.

Continue reading “OPEC is still in a jam and a few of the reasons why.”

Saudi Arabia still in financial trouble, reverses salary and benefit cuts

Image courtesy of Adobe Stock.

Saudi Arabia and OPEC are still in trouble.

Just a few of the articles making that point lately:

  • Is OPEC near an end?
  • Saudi Arabia reverses course on salary and subsidy cuts
  • Continued drain of foreign reserves

3/31/17 – Oil Price – The End of OPEC is Near – Author Rakesh Upadhyay defines a cartel as:

…a group of like-minded producers, who act in concert—or collusion—to achieve a shared goal of increasing their profits by means of restricting supply, fixing prices, or destroying their competition by illegal means.

Article provides a history of OPEC’s efforts to control oil prices over the decades and then gives a recap of last few years.

OPEC tried to take out American shale drillers in 2014. Prices dropped further than they expected. Over 100 US producers went BK. US output dropped from 9.7M bopd to 8.9M bopd.

However, the drillers that survived developed more economical, more productive, and more effective techniques. Huge numbers of driller survived.

So, taking out US shale drillers didn’t work.

Thier next step? (Which also didn’t work?)

Continue reading “Saudi Arabia still in financial trouble, reverses salary and benefit cuts”

Graph of daily rig count in North Dakota

Training rig in Williston. September 2015 photo by James Ulvog.

I’ve been watching the tally of daily rig count for a while. When I think about it, I jot down the count listed at The Million Dollar Way blog.  Occasionally, as in every few months, I post my tallies.

By the way, if you have even the slightest interest in my comments on my blog you really, really, really need to read MDW.

Decided to put all that data into a graph to help me see the trends from another direction. So, I combined all the data that has been accumulated haphazardly over time and put it in a graph.

If it helps you see some patterns, I’ll share my graph.

Keep a few things in mind:

  • The data is accumulated when I think of jotting it down, so this is not a complete database
  • Don’t read anything in to the gaps in data
  • Data hasn’t been double-checked, so there are likely inaccuracies
  • This shows general trends
  • The efficiency of drilling and total output from a well has improved radically in the last few years so data is not comparable over long terms


Having undercut my data and graph, here is a picture of the rig count in the state:

Continue reading “Graph of daily rig count in North Dakota”

An illustration of the horrible economics of residential rooftop solar power

Wealth transfer to wealthy under construction. Image courtesy of Adobe Stock.

Robert Bryce explains in an editorial at the Wall Street Journal on 4/18/17 the lousy economics of rooftop solar panels: Thanks for Giving Me Your Tax Money.

Mr. Bryce appreciates each of us for giving him our money. Of course, it was done through the tax system so it wasn’t much of a gift. Anyone who did not go along with funding his lark would have to spend some time in jail.

He explains he installed a 8,540 watt solar system on his roof. That means the 28 panels generate 301 watts each.

I have been wanting to see financial results from an actual rooftop installation. Mr. Bryce provides a set of actual numbers.

Here is the breakdown of the actual cost:

  • $7,758 – federal tax subsidy
  •   6,593 – subsidy from city owned utility
  • 18,100 – his out-of-pocket costs
  • 32,451 – total cost

That means you and I covered 44% of the cost.

He says his system is generating about 12 mWh MWh of electricity a year.

Hmm. That would be about 32.9 kWh a day. For a system with 8,540 watt capacity, the potential, or faceplate capacity is 205.0 kWh each day. So what’s the capacity production on his system?

Continue reading “An illustration of the horrible economics of residential rooftop solar power”

Volume and value of oil production in North Dakota for the last several years

Where you see one well today, eventually there will be 4 or 8 or 12. That concept and the above photo are yet more illustration of why Bakken, Eagle Ford, and Permian Basin, are strategic threats to OPEC. October 2013 photo by James Ulvog.

Let’s look at some longer term graphs of oil production in North Dakota and the value of that production. Here is a view of the annual oil production in the state:

The fascinating insight from that graph is production did not drop in 2015.

Continue reading “Volume and value of oil production in North Dakota for the last several years”

Swings in oil prices and rig count in North Dakota

There is enough untapped oil under the ground for a whole bunch more of those rigs to work in North Dakota. October 2013 photo by James Ulvog.

If  you want to see one graph that explains the swings of drilling and oil production in North Dakota, take a look at this:

The price of oil for producers in the state collapsed in late 2014 due to the OPEC decision to increase production. The price recovered a bit in mid-2015 but continued to drop into the 20 something range.

The price has been steadily trending up, albeit slowly, since mid-2016.

That graph can then explain a lot of other trends.

For example, look at the count of average rigs in operation. The tally dropped dramatically in 2015. It has slowly been recovering since fall of 2016.

Continue reading “Swings in oil prices and rig count in North Dakota”

Oil production in North Dakota up 5% in February 2017

Illustration why Bakken and Eagle Ford are a strategic threat to OPEC. Photo by James Ulvog.

Oil production in North Dakota increased 5.38% in February to 1,034,168 bopd (preliminary). This follows a 4.14% increase in January. Two large changes in earlier months were an 8.91% drop in December 2016 and a 7.31% increase in October 2016.

I’ve not posted my usual graphs for a few months. Will get caught up in the next few days.

Here is a graph of average daily production, both state-wide and Bakken-only:


Here is a longer term view, with average daily production since 2004:

Continue reading “Oil production in North Dakota up 5% in February 2017”

Initial reports for solar panels embedded in road. Well, actually, a walkway. Output worth around a nickel per day.

Image courtesy of Adobe Stock.

A prototype of solar panels installed in roads is being tested. Results are not particularly promising. (Similar story could be told of two projects in Europe, but will have to cover that another day.)

10/18/16 – Daily Caller News Foundation – Solar Road is “Total and Epic” Failure, 83% Of Its Panels Break in a Week – The test project is in Idaho. The concept is that 30 panels installed in a street (actually a walkway so the panels are not actually getting the wear of being in a road) will provide enough power to run a water fountain and the lights in a restroom.

Eighteen panels were DOA. Another five panels failed after a rain shower. Not a hail storm. Not an unseasonal torrential rain. Not a blizzard, as happens often in northern locations. Like Idaho.

A shower.

Article says only 5 of the 30 panels were working at the time.

Continue reading “Initial reports for solar panels embedded in road. Well, actually, a walkway. Output worth around a nickel per day.”

Recent counts of drilling rigs in North Dakota

Drilling rig at dawn. Photo by James Ulvog.

The count of drilling rigs in operation across the state has shown strong increase since fall ’16.

Here is a recap of the North Dakota rig count, all from Million Dollar Way. It has been a while since I posted an update.

Keep in mind that the dramatic increase in productivity and production per well means that the number of rigs isn’t anywhere near as important as it was several years ago. At the same time, the count of rigs is still one indicator of activity. Perhaps the long-term trends aren’t important while the shorter term trends are.

Keep in mind I gather data when I think to make notes on the count. Also, I haven’t double checked the numbers, so there very well could be some errors.

Continue reading “Recent counts of drilling rigs in North Dakota”

Updates on Bakken

Gotta’ get that well back in production. Crew on workover rig working well after dark. Photo by James Ulvog.

Here are four articles providing a bit of background on what’s going on in Bakken.

You have likely noticed I have long relied on The Million Dollar Way for my education on oil in general and Bakken in particular. Just look at the source for the following four articles. That makes it sorta’ cool when on 3/22 MDW recommended my post Scratching my head at the geopolitical impact of fracking. Thanks for the mention!

2/19/17 – The Million Dollar Way – EURs – Bakken 2.0 – EUR means Estimated Ultimate Recovery, which is the total amount of oil expected to be extracted from one specific well.  Article says the EURs in Bakken were 300K early on. At the point I started paying attention, the EURs were in the 500K range with possibilities of 1,000K.

Article says Mike Filloon has been talking about 1.5M instead of 1.0M.

Now the article lists 14 wells with EURs of 1.5M up to 2.0M EURs.

Continue reading “Updates on Bakken”

More disruption in the electricity grid from all that solar output

Curtailed electricity in California during 2016 was greater than the output from any one of those towers. Photo by James Ulvog.

The routine surge of electricity during the late morning and early afternoon in California is disrupting the electricity system. Matching the excess production of electricity during the day with highest use in the evening is going to be expensive for consumers.

The underlying issue is solar is neither reliable nor dispatchable.  The issue is beginning to be a problem and will get far worse.

3/5/17 – Wall Street Journal – How California Utilities are Managing Excess Solar Power – There is so much solar power in California that when the sun is bright, there is too much electricity and it must be sold cheaply just to get rid of it. Then, when the sun goes down and demand goes up after people get home from work, there isn’t enough electricity and the spot price goes sky high.

Article says that during the day, the wholesale spot price of electricity frequently shrinks to zero. Occasionally the wholesale spot price can hit $1,000 a megawatt-hour after dark. That would be about a dollar a kilowatt. $1.00.

At the end of the article there is a comment that on 178 days in 2016 the wholesale price went negative. The spot was below zero. The solar plants in California had to pay someone to take the excess electricity. I wonder what that does to the bottom line at Ivanpah? (That is a rhetorical question. – Impact on them is zero because I think they are on a multi-decade fixed price contract.)

Huge battery plants can store electricity during the day and discharge at night. That is expensive. Article says the price ranges from $285 up to $581 a megawatt-hour, which is in contrast to a natural gas peaker at $155 to $227 a megawatt-hour. That is around twice as expensive.

3/18/17 – David Danelski of Press-Enterprise at Daily Bulletin – Here’s how California ended up with too much solar power – The amount of solar power now online in California is so high that it is disrupting the electricity market.

The impact of so much solar capacity shows up at two times during the day.

Continue reading “More disruption in the electricity grid from all that solar output”

Scratching my head at the geopolitical impact of fracking

That little ol’ thing, along with 500 similar contraptions, is changing the world of oil production. Photo by James Ulvog.

Looks like we are in the midst of radical change in regional and world politics caused by the technological revolution in oil and gas production. I keep trying to wrap my little brain around what is going on. Here are a few articles that may stretch your brain too.

  • Brain stretcher on the shift in geopolitics due to increased US oil production
  • Speculation why the Saudi government’s plan to re-engineer their country’s economy isn’t going to work
  • Three articles on the rapidly increased US shale production undercutting the OPEC production cut

3/12/17 – PJ Media – The Problem of Success – Article raises the unsettling idea that nobody has figured out the impact of dramatically increased production in the US.

Neither the previous US administration, the current US administration, leadership in Saudi Arabia, leadership elsewhere in the Middle East, nor even pundits for that matter, have figured out how geopolitics will change as Saudi Arabia loses its role as dominant oil producer and the decentralized American drillers gain the swing producer role.

It stretches my brain even to understand there is an issue.

American frackers used the dramatic run up in oil prices to $100 as an opportunity to figure out how to frack oil where it could never have been touched before. They then used the collapse in prices as an opportunity to figure out how to frack far more efficiently, far more effectively, with far higher production output from every well. As a result, the break-even price for U.S. shale has shrunk.

The vast network of independent producers are responding to price changes far faster than OPEC could handle or the majors could ever dream of. Prices go up somewhat and in about three months US production is surging.

Continue reading “Scratching my head at the geopolitical impact of fracking”

What Peak Oil? I’m having trouble keeping up with all the billion barrel finds.

15 wells on 1 pad. Notice a drilling rig on right edge of view. September 2015 photo by James Ulvog.

Yeah, I’m still new to this effort of watching the energy field. One of the things that still amazes me is the frequency with which the geology wizards find another billion or so barrels of recoverable oil that ‘we’ didn’t know about and a decade ago couldn’t get out of the ground profitably even if the wizards had known for sure it was there.

3/9/17 – E&P – Repsol, Armstrong Strike Big Oil Find in Alaska’s North Slope – The two companies announced a find in the Nanushuk Play with 1.2 billion barrels of recoverable oil. Two wells confirm the find.

First production is expected in 2021, four years from now. Production level expected to hit 120,000 bopd, or 43.8M barrels a year.

Oh, what Peak Oil?

By the way, I’m having a hard time keeping track of all these massive new finds of oil which either nobody knew about a decade ago or it would have been technically impossible to ever get any of it out of the ground.

Continue reading “What Peak Oil? I’m having trouble keeping up with all the billion barrel finds.”