With rig count dropping in the state, thought I’d look at the history of how many rigs are in operation. Here are two graphs to give some historical background. Data is from the website of the North Dakota Industrial Commission, Department of Mineral Resources, Oil and Gas Division. The general statistics page is here. Go to the monthly statistics line for the annual reports.
Here is the average count of rigs by month:
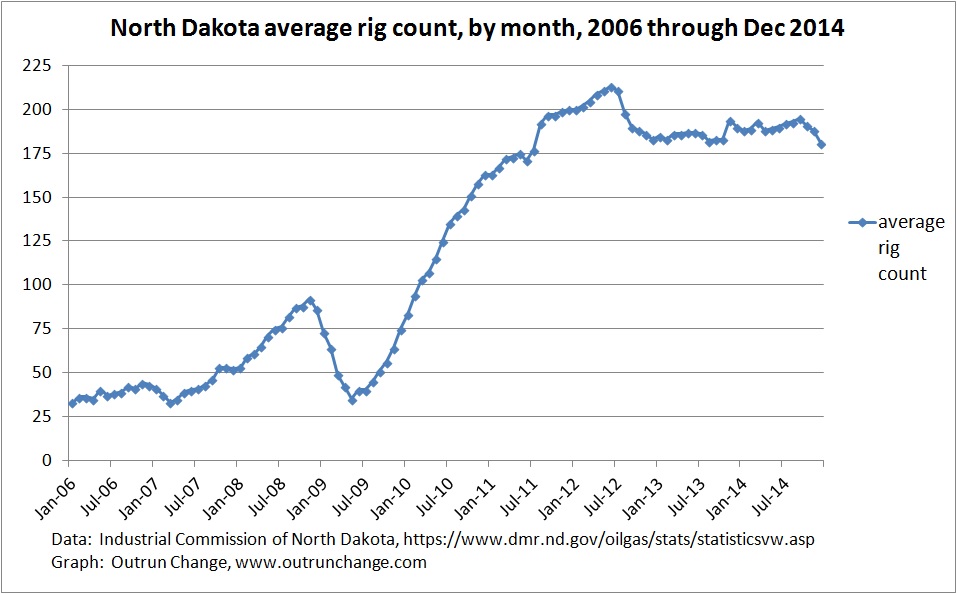
The impact of the Great Recession hit the rig count in late 2008 and early 2009. I think the drop in rigs in 2012 is due to rapid increases in productivity. Multipad drilling using walking rigs meant one rig could drill lots more wells.
Drop in count is quite visible in the last four months.
Here is the average count for each year:
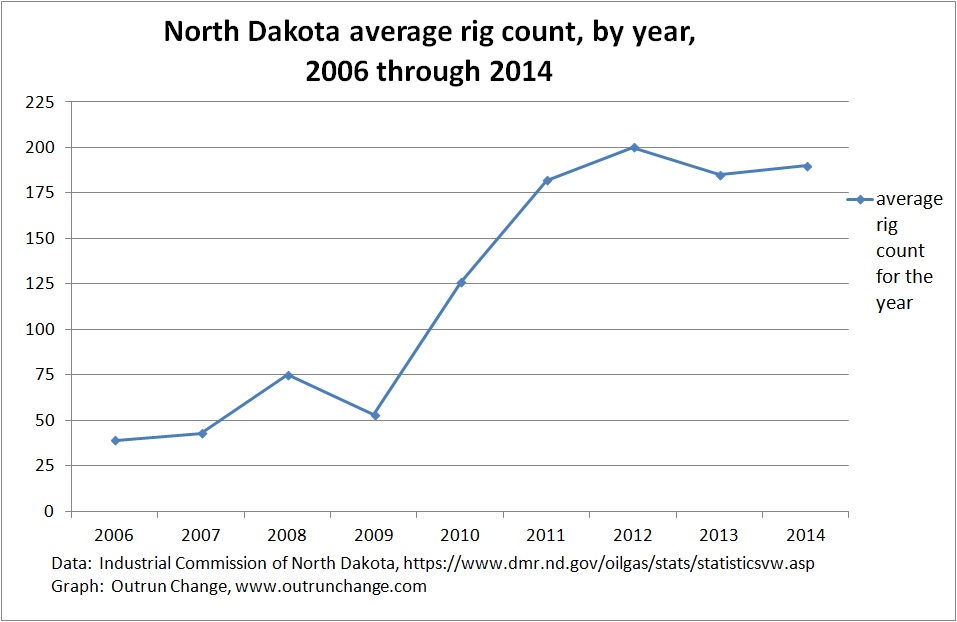
Drop in ’09 is quite visible.
My graphing ability is improving rapidly, having been watching Carpe Diem for a few years and learning a lot from Prof. Mark Perry by watching closely. Only took a few minutes to develop the above graphs.