Each month after the statistics are released for North Dakota oil production, I run a few graphs showing the story of what is going on there.
Here are a few more for May 2015.
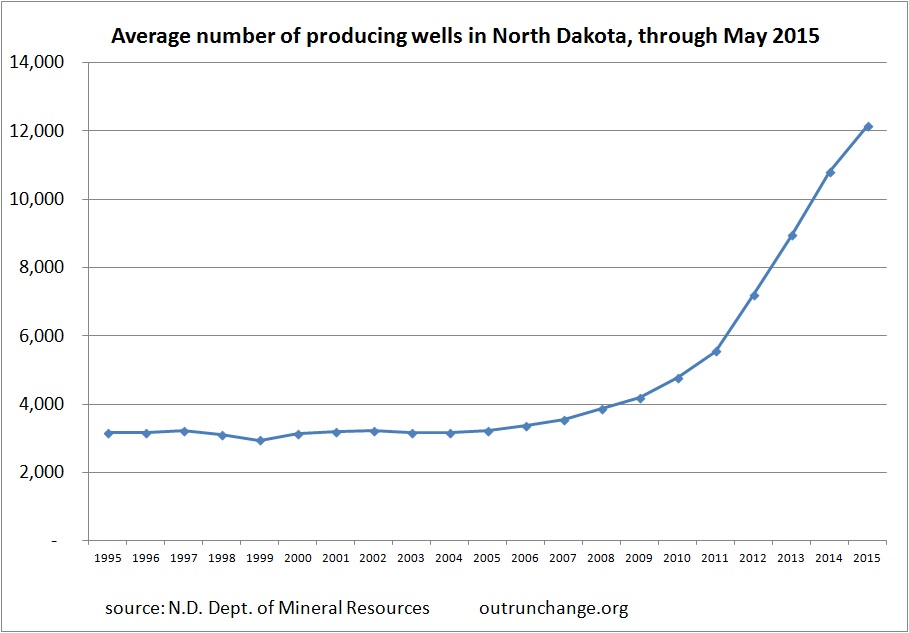
Average number of producing wells by year. This is the number of producing wells in the statistics, here and here, with my calculation of the average of the monthly amounts. You can see a breakout in 2010 and 2011. The huge increases are in ’12, 13, and ’14. Even with the slump in prices, which led to a drastic drop in the number of drilling rigs, the average number rigs in ’15 has increased more than any year prior to ’12.
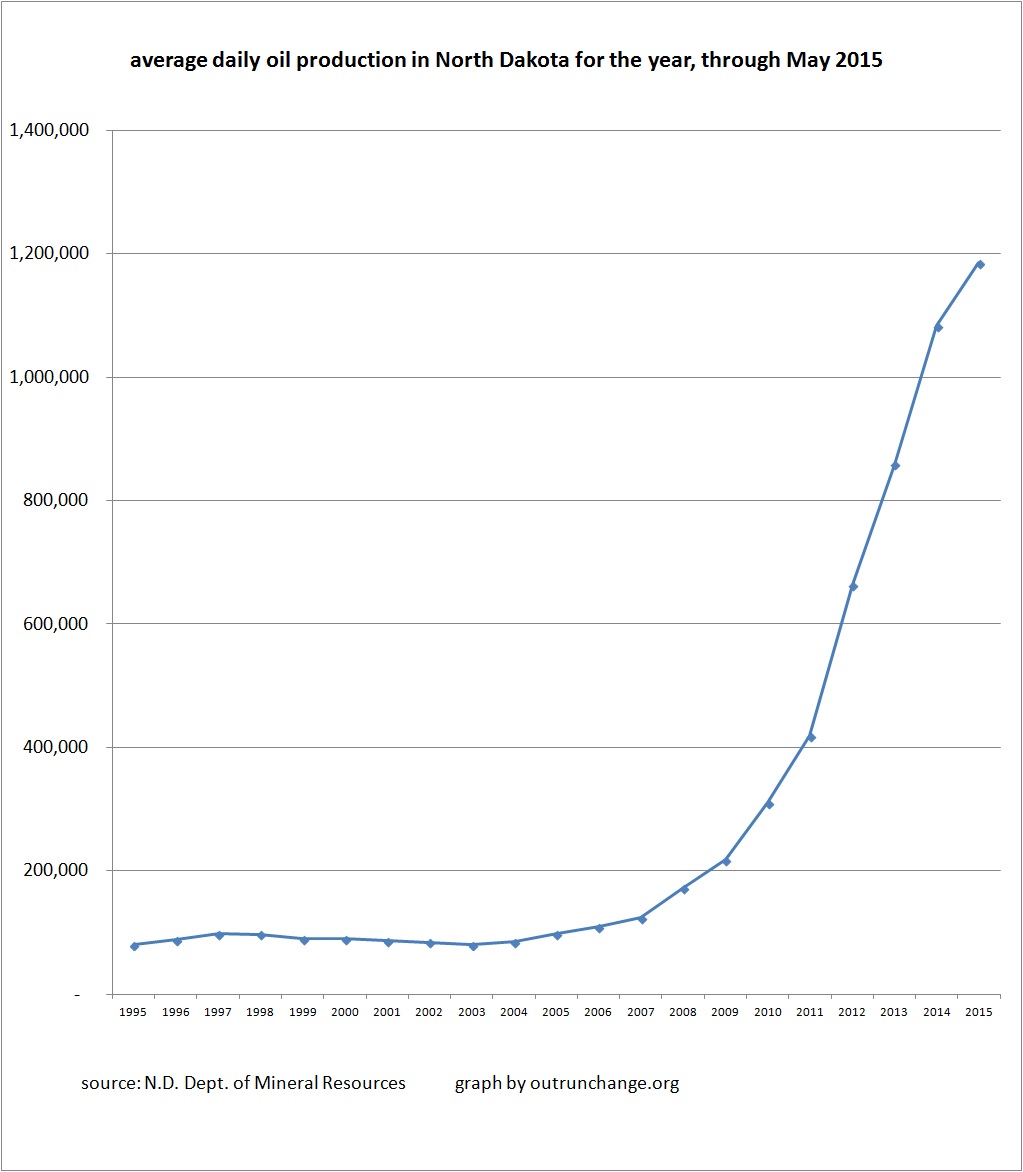
Average daily production for the year. Another way to look at the information in this post.
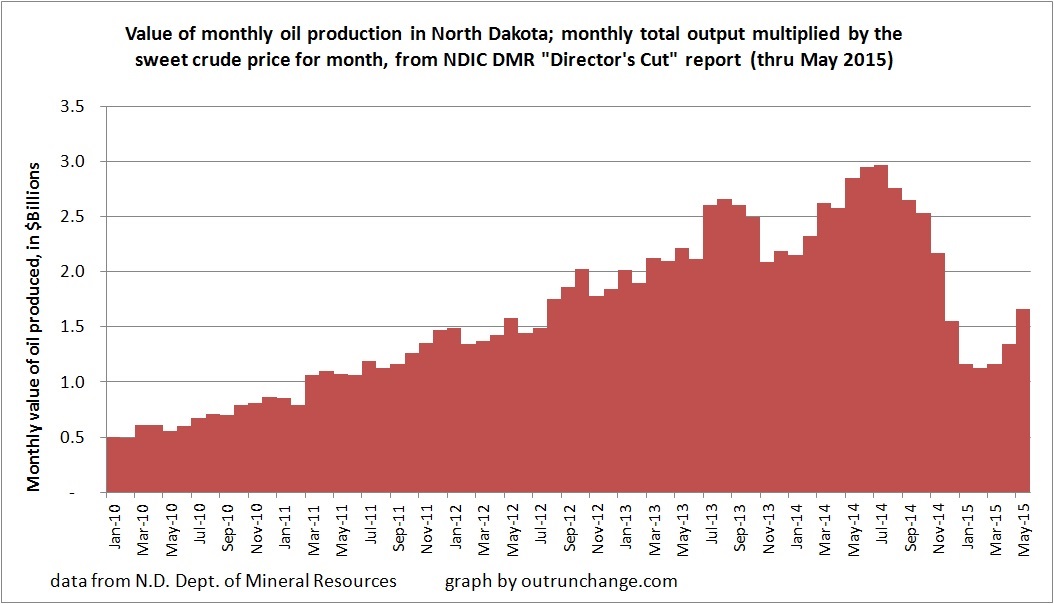
Value of oil produced. This is calculated by multiplying the total number of barrels produced by the average price in the state as reported in the Director’s Cut. Recovery in April and May is due to rise in crude oil prices. My guess is the value of oil in June will go up and July will go down. That is based on price the director has already reported for June and the current price on 7/10.