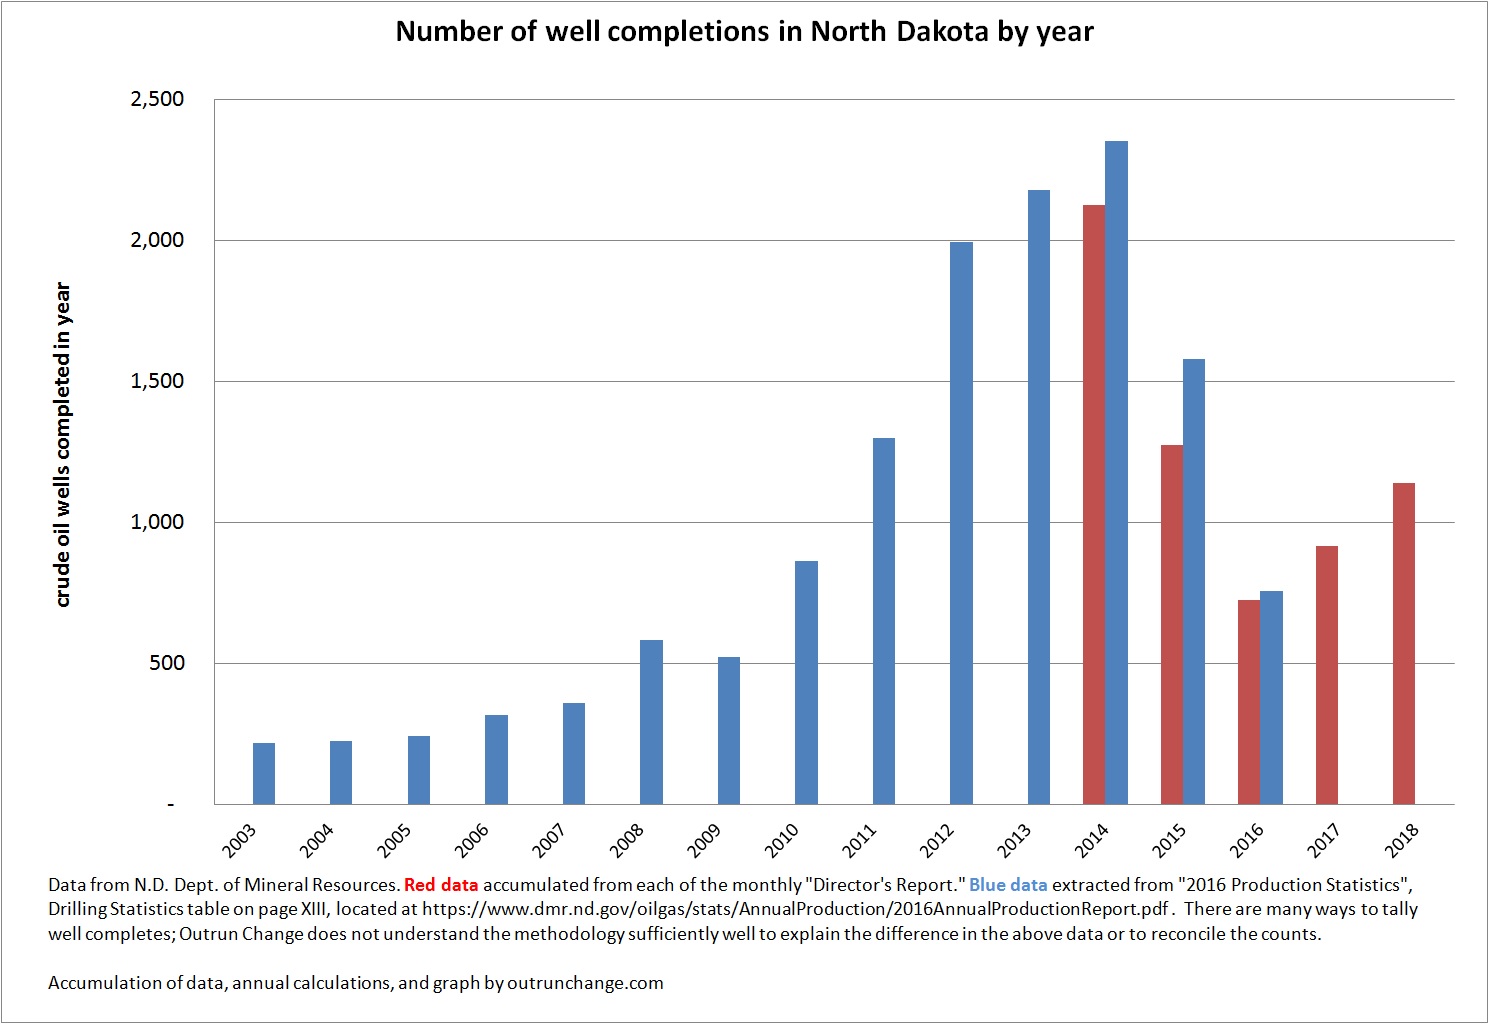
While pulling together the graphs of oil production in North Dakota for 2018, I wondered what the trend of well completions might look like.
So, pulled a graph together. Primary source of my data is a spreadsheet I maintain of the monthly information released by the N.D. Department of Mineral Resources. Well completions is one of many data points accumulated on the spreadsheet.
As I pulled together the yearly total, realized my spreadsheet only accumulated the well completion tally back to late 2014. So I pulled the monthly Director’s Reports and entered the monthly amounts for the rest of the year. That was tedious, so to get earlier info, I poked around at the North Dakota Drilling and Production Statistics page. Found Annual Production Reports, which give vast amounts of info beyond what I can understand. Several tables break out the well completion information. Pulled the annual tallies of completed wells off that report.
Immediately noticed there is a big difference between my tally of the monthly reports and the annual information. The completion stats include total wells, total productive, and then a breakout of those amounts into 10 categories.
I don’t understand the difference between the annual reports and the amounts in the monthly reports. Won’t try to sort out the differences. There is obviously an easy and clear way to explain the different ways to count well completions, I just don’t have any idea what it would be.
The two sets of data are consistent with each other and the trends are informative. The latest annual data is for 2016, so I will place the two sets of data side-by-side.
Here is my tally of the monthly completions and the annual completions reported by the state:

