Estimate of lifetime financial performance of one Bakken well

Since I’m an accountant, I keep an eye out for info on how one well might perform over its lifetime. Any real data for a well, let alone enough to look at averages, would be a closely guarded trade secret, so I’ll talk about public info.

Of course, if someone wanted to confidentially drop me some actual data & forecasts for real wells, I’d be happy to describe anonymous data. In the meantime…

Ms. Tessa Sandstrom, of the North Dakota Petroleum Council gave a speech reported by the Minot Daily News: Oil Boom drives on.

The article gives this info: Continue reading “Estimate of lifetime financial performance of one Bakken well”
Williston pulls liquor licenses from two strip clubs

There are downsides to a booming economy. Things can get out of control with an overwhelming increase in men who work long hours for good money: they need something to do when not working.

With a serious imbalance in the proportion of men and women in Williston, guess what, those guys wind up at the city’s two strip clubs.

The two places are next door to each other. Not a good deal – get bounced out of one for being rowdy and you can stumble to the other.

As you would expect there has been a surge in police calls to the two clubs.

Continue reading “Williston pulls liquor licenses from two strip clubs”

One data point for drilling costs in North Dakota

Bruce Oksol at Million Dollar Way provides one hard data point for costs to drill in Bakken for one producer in their particular locations with their specific techniques. May not apply to any other drillers, but a hard data point is useful.

Bakken Well Costs says: Continue reading “One data point for drilling costs in North Dakota”

Peak Oil = Flat Earth? – #23

Has the Peak Oil concept, which is the idea we can calculate the day that oil production irreversibly starts a catastrophic drop and calculate the specific year we use the last drop of oil, finally gone the way of the Flat Earth Society?

The answer is yes. At least that is the suggestion from an article by Mr. Colin Sullivan at EnergyWire: Has ‘peak oil’ gone the way of the Flat Earth Society?

The article starts with a graph from the 1950s showing a bell curve of all the oil production from 1850 through 2200 (yes, that would be 240 years out). The cumulative production to the c.1950s is exactly 90×10^9, or 90B. Proven reserves are 250B barrels. All future discoveries, under a smooth bell curve peaking at 2000 are 910B barrels. Total oil on the planet ever to be produced is precisely 1,250B barrels, give or take a rounding error.

Only problem with the entire concept? It’s wrong. Why? Continue reading “Peak Oil = Flat Earth? – #23”

North Dakota oil production back to setting new records

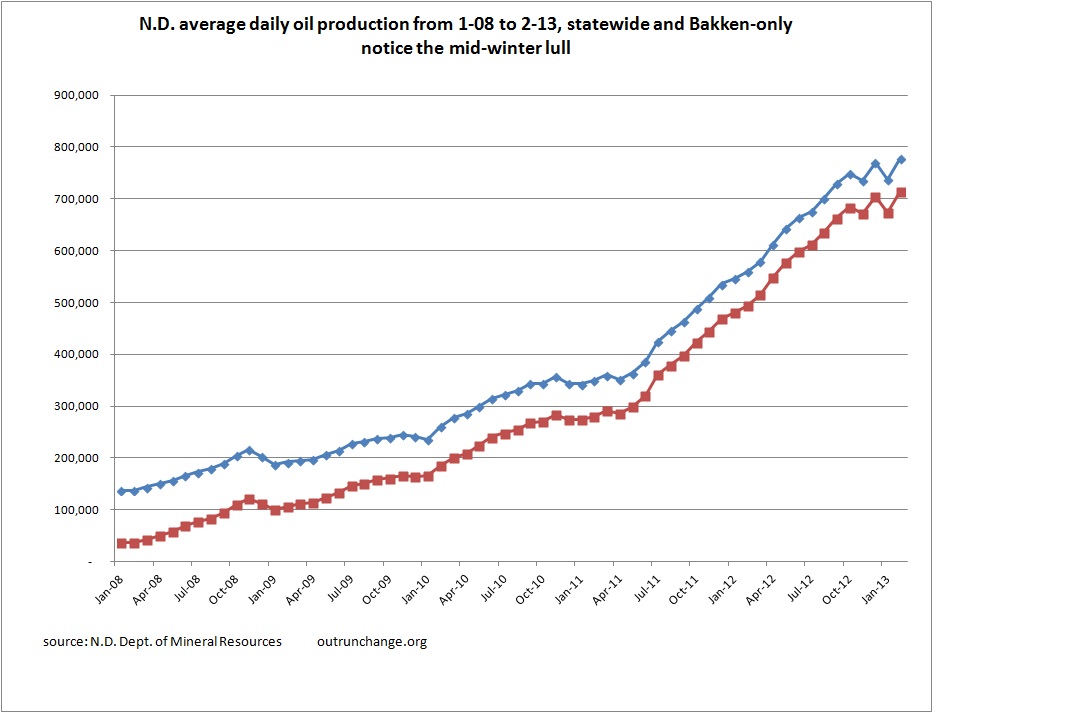
February production averaged 779,032 barrels per day. That is up 5.57% over January. It is only up 3.9% over October, which reflects the impact of bad weather this winter.

Spring thaw means load restrictions from what I’ve read. That means production will slow again soon.

Here’s my graph of monthly production:

 2-13 production

 (click to enlarge)

Yet another analysis why the Peak Oil concept is dead – #22

An investment manager, The Boston Company, has a paper out which explains from an investment perspective why Peak Oil is dead. The paper starts with an explanation of the concept:

For decades, pundits have been trying to predict a tipping point for Peak Oil – when a sustained and unabated climb in oil prices sparks a near-collapse of the global economy. According to Peak Oil theory, the rate of petroleum extraction will crest and then begin an immutable decline, pushing oil prices ever higher as demand for this finite resource permanently exceeds supply.

You can find End of an Era: The Death of Peak Oil at their website.

They cite several causes for the passing of the late Peak Oil.

Continue reading “Yet another analysis why the Peak Oil concept is dead – #22”

2013 Impact of the Eagle Ford Shale field

The University of Texas San Antonio released their 2013 study of the impact of drilling in Eagle Ford. You can get the full report here.

I’ve read through the slide deck for the presentation on 3-28-13. Here a few cool things I think are highlights:

Check out the explosion in drilling permits: Continue reading “2013 Impact of the Eagle Ford Shale field”

Economic impact of Eagle Ford – $61 billion – 2013 report

The University of Texas San Antonio released today their 2013 study of the impact of drilling in Eagle Ford.

I’ll have comments on the report in the next few days. It is a great report.

You can get the report here. If you want more details, the appendix is here.

Continue reading “Economic impact of Eagle Ford – $61 billion – 2013 report”

Inconvenient production data – Peak Oil #21

Vaclav Smil has an article at The American, “Memories of Peak Oil” that looks at oil production data over the course of a decade.

He pulls data from BP’s annual energy report. Great stuff there.

These are some highlights he points out for production between 2001 and 2011: Continue reading “Inconvenient production data – Peak Oil #21”

Let’s put 5.4B gallons of water used in ND oil drilling in perspective

5.4 billion gallons a year.

That much water can do one of the following:

  • Drill about 1,800 wells in a year that will produce around 85 million barrels of oil in their first 12 months of production, or
  • Provide one-seventh (14.2%) of the water needed for agricultural irrigation in North Dakota for one year, or
  • Provide 18 months of water needed in a Midwest city of 50,000 people, or
  • Provide 3 months of water needed for the 57 golf courses in Palm Springs California. Yes, 13.5 weeks.

Drilling 1,800 wells sounds like a reasonable use of 5.4B gallons of water.

Continue reading “Let’s put 5.4B gallons of water used in ND oil drilling in perspective”

North Dakota oil production drops in January ‘13 because of bad weather

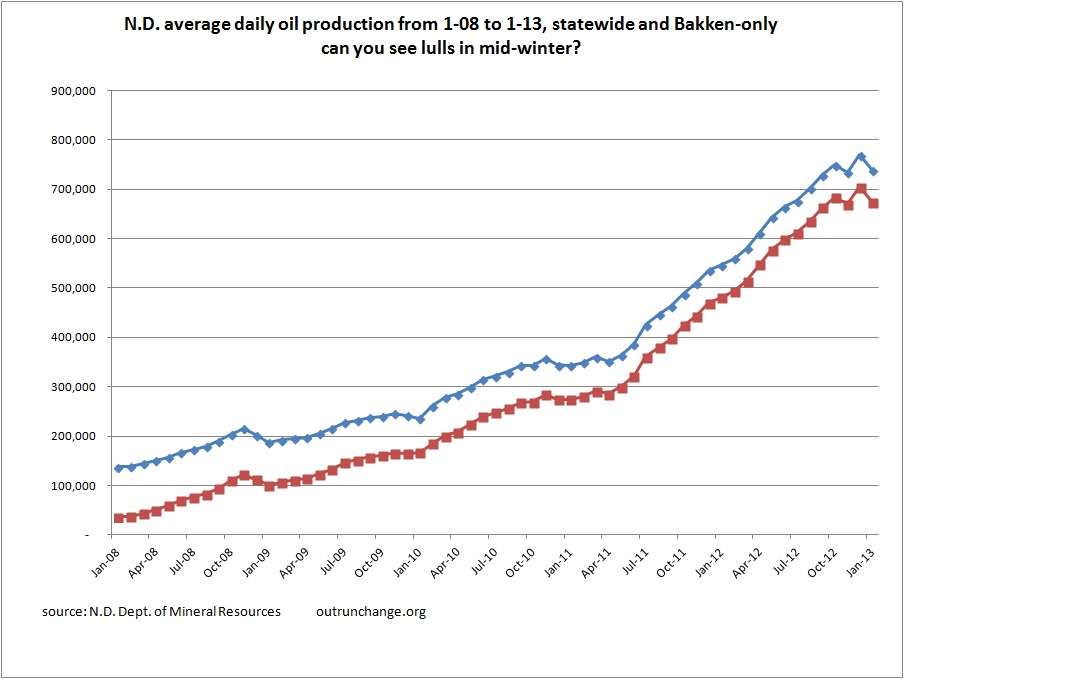
January production dropped to 738,022 BOPD from revised 770,111 in December and preceding high of 749,095 in October.

Comments follow the graph:

 1-13 production

  Continue reading “North Dakota oil production drops in January ‘13 because of bad weather”

The energy frontier is open – Texas edition

The western part of North Dakota is not the only place in the country where every business is looking for help. The same thing is happening in the Eagle Ford and Permian fields in Texas.

Check out Bloomberg’s Eagle Ford Shale Boom Fuels ‘Madhouse’ in South Texas Counties report.

Previously closed businesses have reopened. Just about every store in town has a ‘help wanted’ sign.

Here are a few predictions or estimates for the Eagle Ford and Permian field production levels: Continue reading “The energy frontier is open – Texas edition”

Ethanol fail

When can we start calling it foolishness to burn corn in our cars?

Via Meadia’s post Biofuel Boondoggle Just Won’t Quit begins:

Corn-based ethanol starves the world’s poor and increases greenhouse gas emissions

Standards set by Congress require a certain amount of ethanol be used. Here’s the required amount this year compared to production and expected demand:

Continue reading “Ethanol fail”

More on selective enforcement of laws against killing raptors

I’ve written several articles on the toll that wind farms take on golden eagles, bald eagles, and other migratory birds.

Mr. Robert Bryce has another article in the Wall Street Journal – Windmills vs. Birds.

Golden and Bald Eagles along with sundry other raptors aren’t the only casualties.

Continue reading “More on selective enforcement of laws against killing raptors”

Can we finally bury the Hubbert curve? It keeps getting more wrong. Peak Oil #20

Check out this great graph from The Economist: Peak oil.

I don’t understand the copyright rules well enough to include the graph in my post. In case their article goes away, you can also see the graph at Carpe DiemChart of the day: Peak oil.

Let me describe the graph.

Continue reading “Can we finally bury the Hubbert curve? It keeps getting more wrong. Peak Oil #20”