Oil production in North Dakota up 2.4% in April 2017

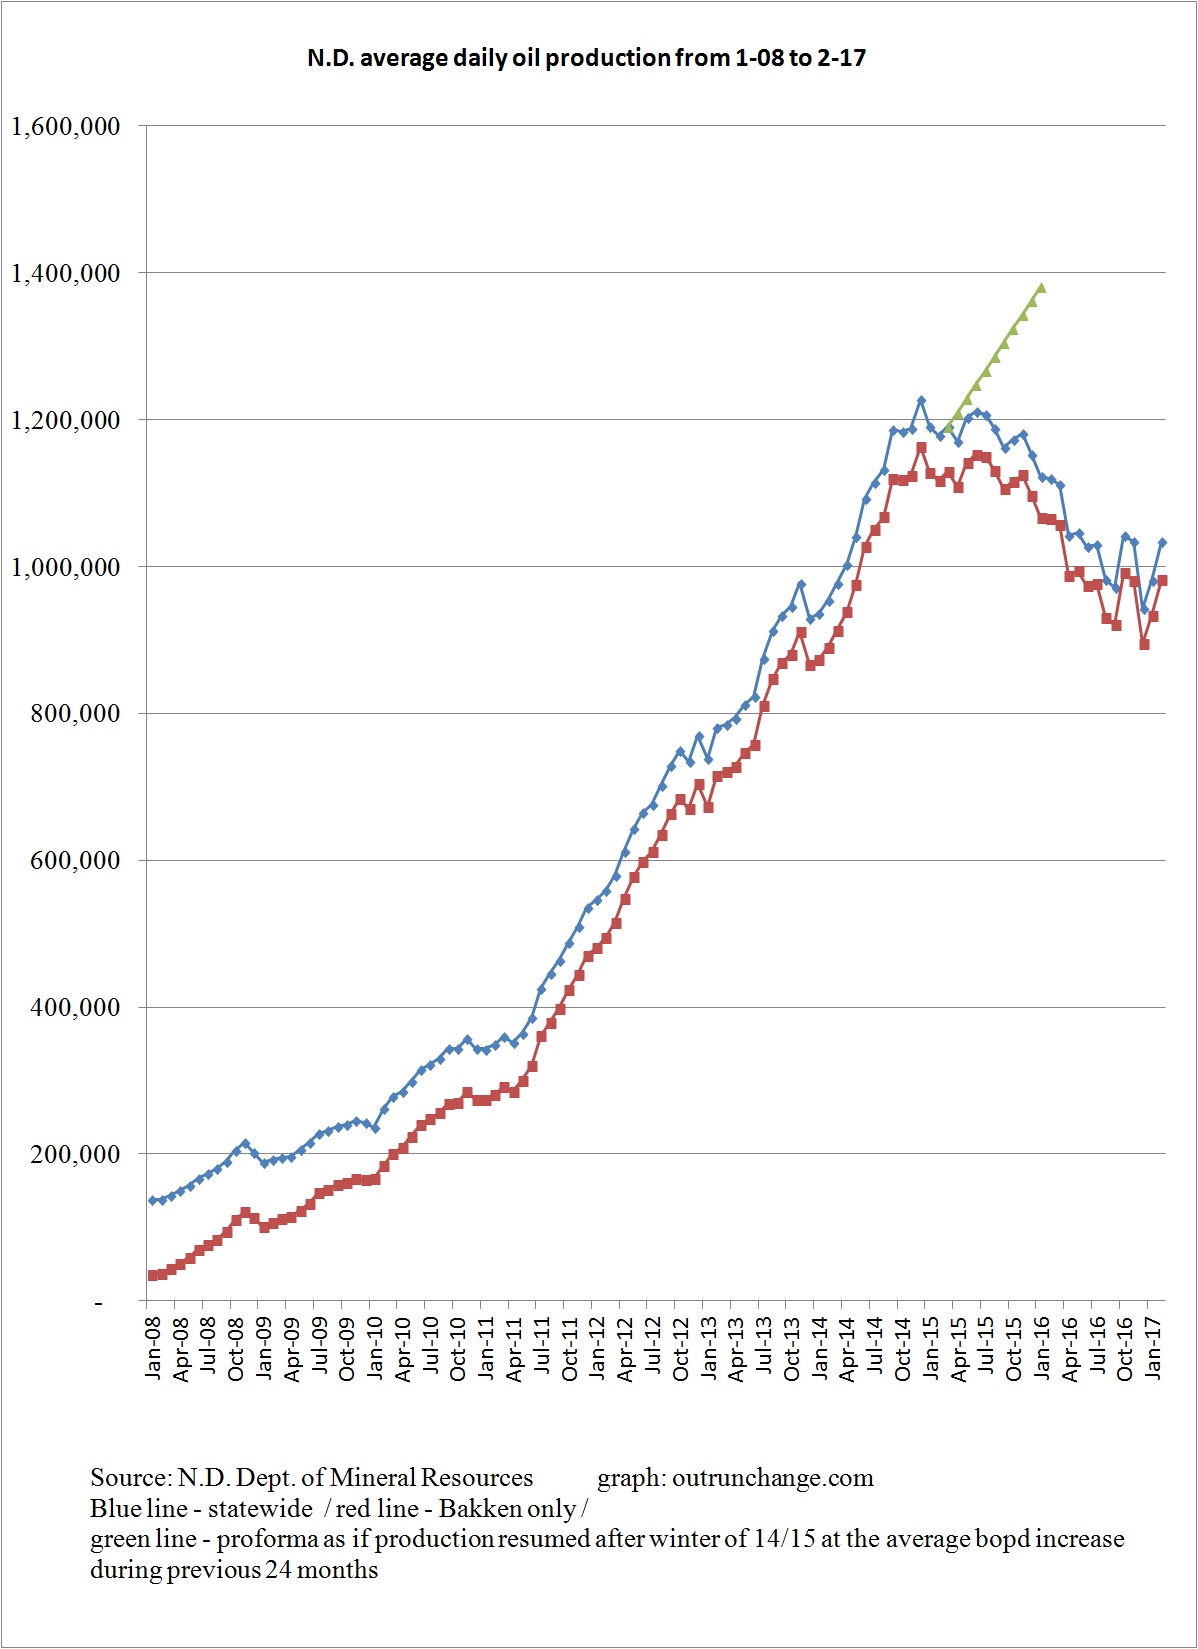
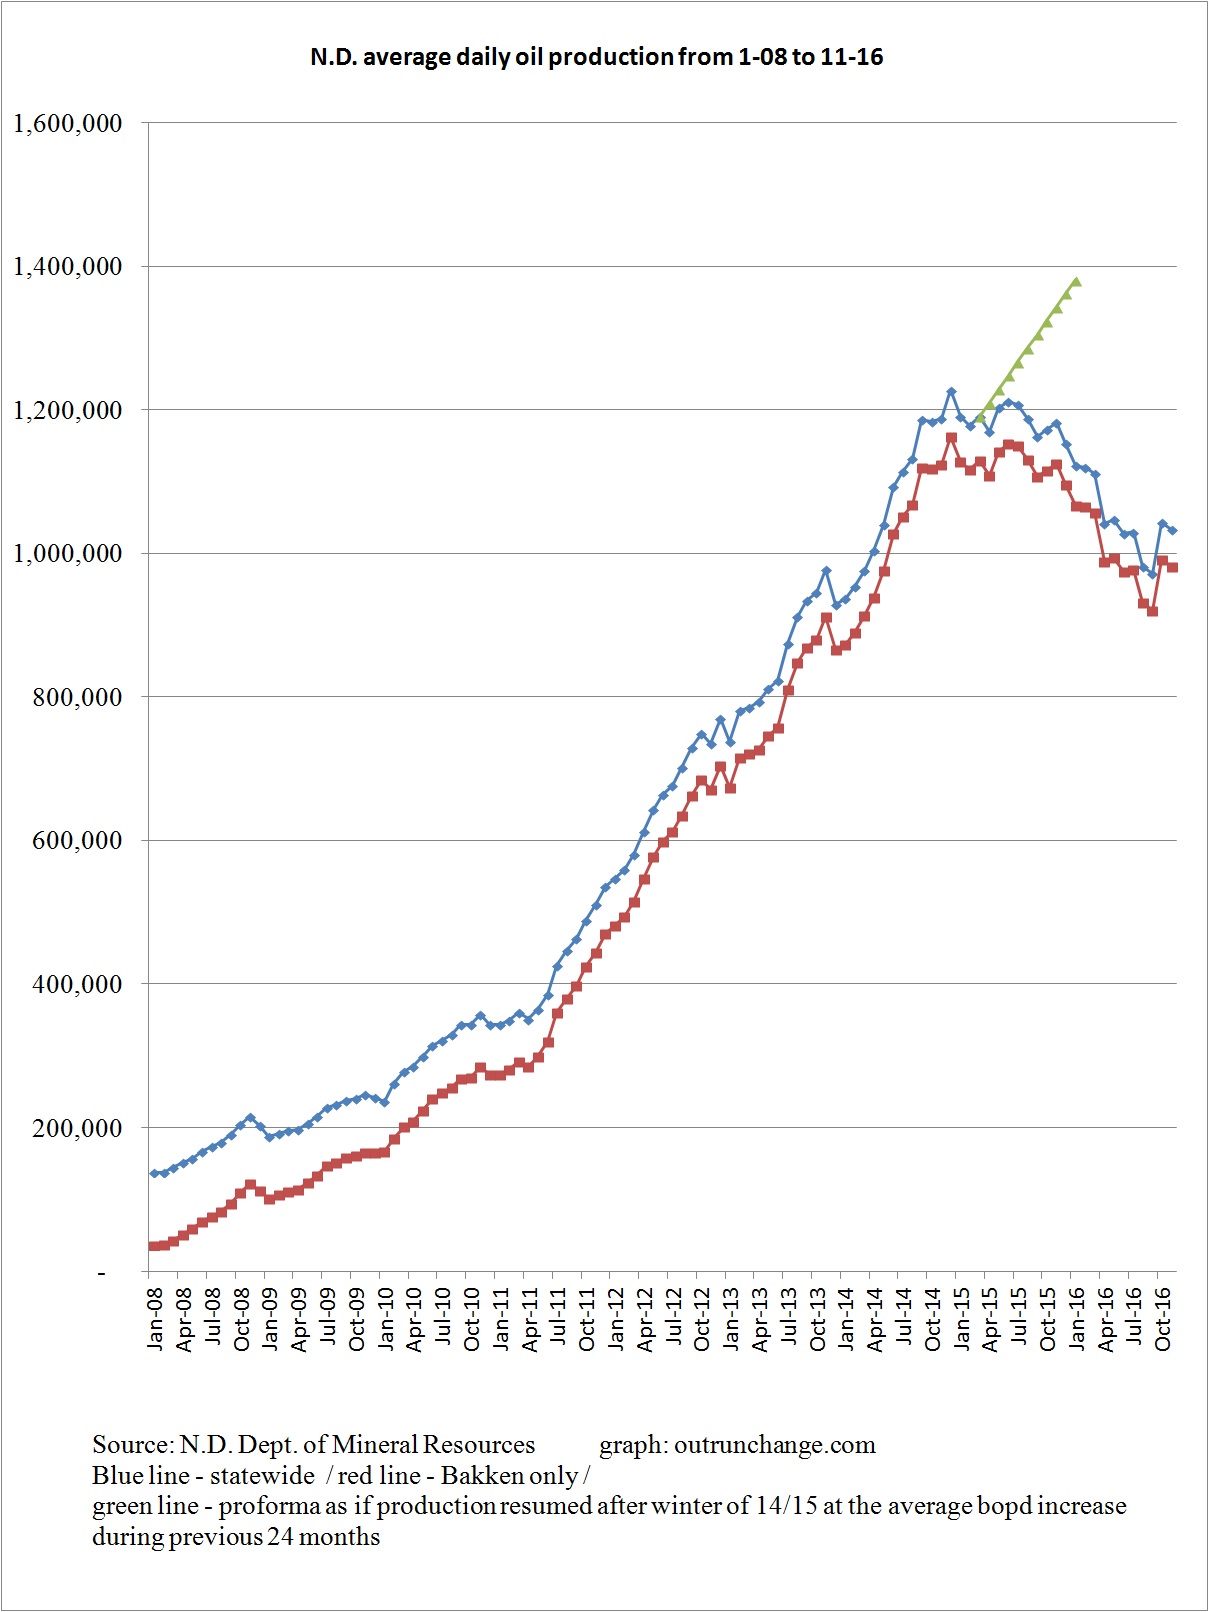
Big increase in production in the state. Increase of 2.43%, from average of 1,025,690 bopd in March (revised) to 1,050,630 bopd in April (preliminary). That is the highest average production since March 2016. The April production was only 160,700 below the high water mark of 1,207,276 bopd in July 2015.


That upslope since last fall is not quite what OPEC+Russia had in mind.

Million Dollar Way pointed out the production increased at the same time as the number of inactive wells increased and the fracklog increased. I sure don’t understand the dynamics.

Producing wells increased 122 to 13,434; fracklog increased 141 to 830; inactive well count increased 167 to 1,466. Some of that is a recovery from drops in March.

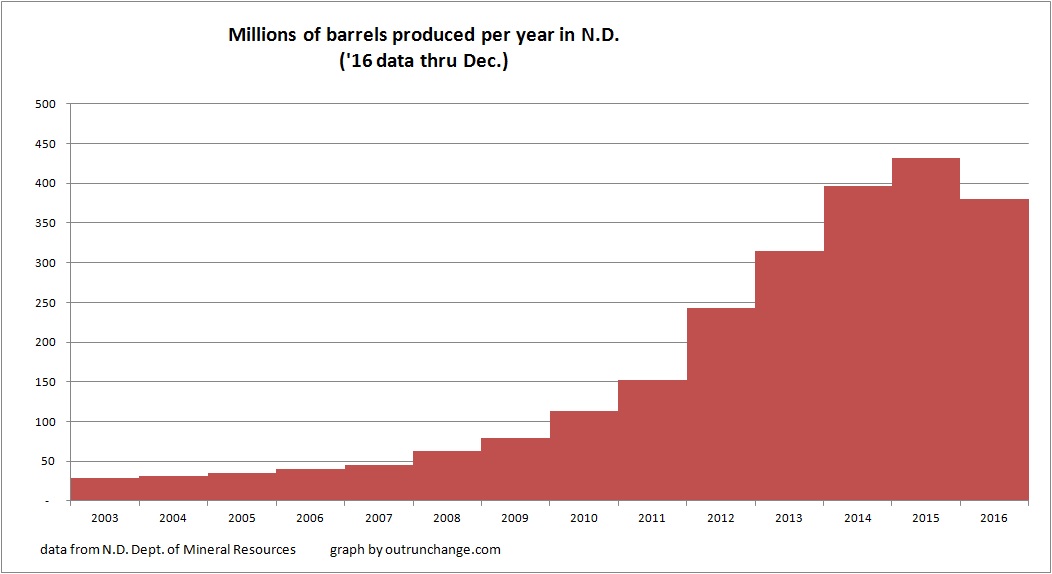
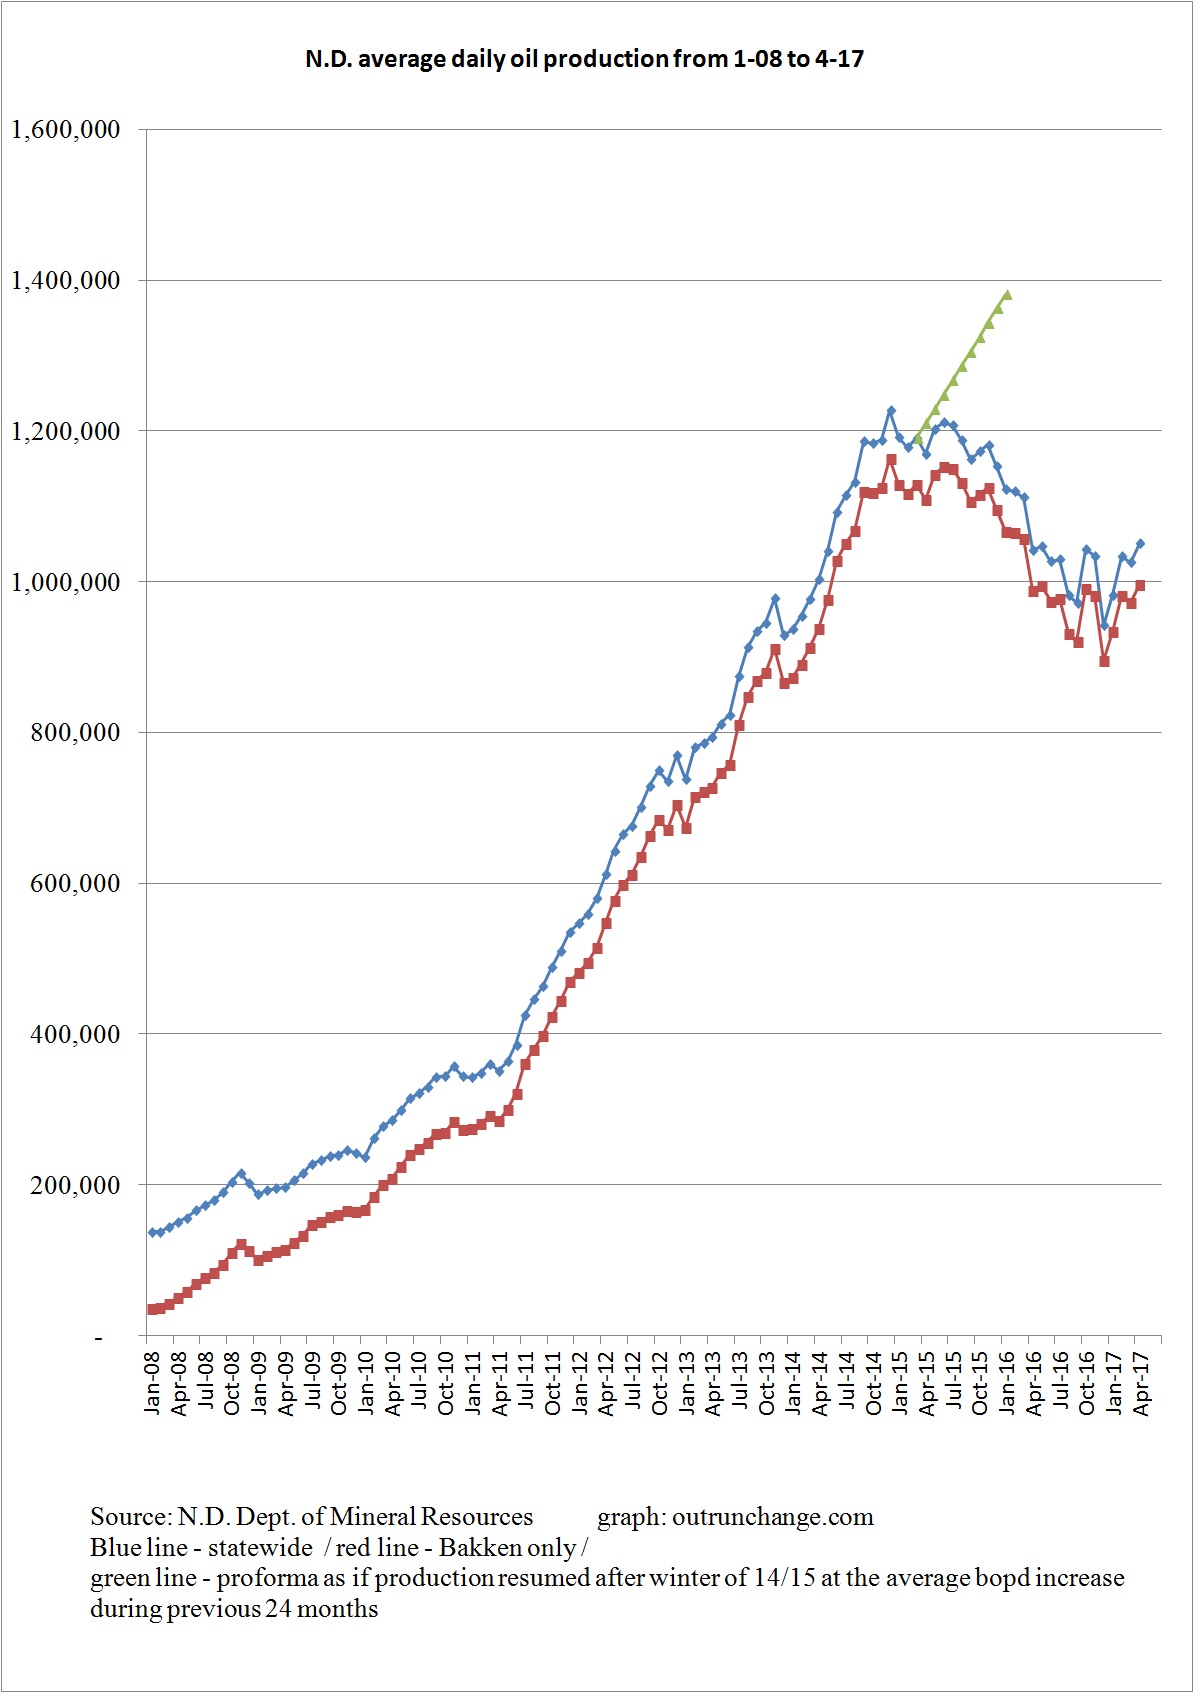
Here is another graph of production, for a longer term perspective:

Continue reading “Oil production in North Dakota up 2.4% in April 2017”

OPEC+Russia extend production cuts

Those five pads have 7, 1, 2, 3, and 6 wells. I’ll guess each pad will eventually have about 7 or 8 wells. That would be about 40 reasons OPEC+Russia had no choice but to extend production cuts. Photo by James Ulvog.

I don’t publish more than one post a day anymore, but with the following headline showing up today, gotta’ run another:

5/25/17 – Wall Street Journal – OPEC Extends Oil Output Cuts but Glut Fears Persist – OPEC plus Russia plus 10 other producers agreed to extend their production cuts until March 2018.

Article says this has strengthened the relationship between Saudi Arabia and Russia, the worlds’ two largest oil producers.

The combined cuts for all the participants is around 1.8B bopd down from a year ago.

Article points out the obvious: OPEC+Russia had no choice but continue the cuts. If they didn’t, the extra oil would further drive down oil prices. Their production cut hasn’t actually succeeded in pulling prices up where they wanted, but the alternative would have been even lower prices.

Continue reading “OPEC+Russia extend production cuts”

Lots of good news for consumers about oil. Not so good news for OPEC.

How much oil to pump?   Oil pump jacks in the desert of Bahrain, Middle East. Photo courtesy of Adobe Stock.

Lots of articles lately describing what is going on in the oil market. If you are a consumer, the news is rather good. If you are a part of OPEC, the news is quite grim. If you are a U.S. producer, there is a lot of opportunity.

5/17/17 – Daniel Yergin at Wall Street Journal – The Struggle Behind Oil’s Ups and Downs – Another must read, but then anything Mr. Yergin writes is in that category.

Here is my feeble try at a summary:

Mr. Yergin sees two forces at play in the oil market.

First is the pressure to balance supply and demand. US shale producers increased production a lot in 2014 which created an imbalance in the supply, which pushed prices down. Instead of dropping production to maintain prices, Saudi Arabia increased production, which further oversupplied the market and caused prices to collapse.

When prices dropped further than expected, the Saudis worked out a deal to cut production last November. That brought prices up.

In turn, that motivated shale producers to increase drilling, which is increasing US production, which will put more US shale oil on the market than expected, which will put substantial downward pressure on prices later this year.

Second is the recalibration of technology and internal pricing to reduce the cost of production.  The innovation and efficiency gains in the last two years are remarkable.

Continue reading “Lots of good news for consumers about oil. Not so good news for OPEC.”

Various updates from Bakken

Another dozen reasons OPEC is in distress. Two reasons are quite visible. Another 10 reasons are the open spaces on that large pad where additional wells are going to be drilled someday. Notice the large number of storage tanks, which is far more than what’s needed for just 2 wells. Photo by James Ulvog.

Here is a variety of news tidbits I’ve noticed lately from Bakken:

  • airport construction underway
  • lots more jobs opening up
  • EURs now in range of a million barrels of oil
  • oil starts flowing through DAPL
  • frac sand mines running full steam ahead

4/14/17 – The Million Dollar Way – New Airport Work to Begin Next Week – Official groundbreaking ceremony was in October 2016. The start of massive grading and site work starts the week of April 17, 2017.

4/14/17 – Amy Dalrymple at Oil Patch Dispatch – ND Oil Production Up 5 Percent; Bakken Needs 1,000 Workers to Fill Oil Jobs, Regulator Says – Mr. Lynn Helms, director of the Department of Mineral Resources was surprised by the 5% increase in production in February.

He expects aggressive drilling in the summer, after a lull in the spring due to load restrictions.

Continue reading “Various updates from Bakken”

Volume and value of oil production in North Dakota for the last several years

Where you see one well today, eventually there will be 4 or 8 or 12. That concept and the above photo are yet more illustration of why Bakken, Eagle Ford, and Permian Basin, are strategic threats to OPEC. October 2013 photo by James Ulvog.

Let’s look at some longer term graphs of oil production in North Dakota and the value of that production. Here is a view of the annual oil production in the state:

The fascinating insight from that graph is production did not drop in 2015.

Continue reading “Volume and value of oil production in North Dakota for the last several years”

Swings in oil prices and rig count in North Dakota

There is enough untapped oil under the ground for a whole bunch more of those rigs to work in North Dakota. October 2013 photo by James Ulvog.

If  you want to see one graph that explains the swings of drilling and oil production in North Dakota, take a look at this:

The price of oil for producers in the state collapsed in late 2014 due to the OPEC decision to increase production. The price recovered a bit in mid-2015 but continued to drop into the 20 something range.

The price has been steadily trending up, albeit slowly, since mid-2016.

That graph can then explain a lot of other trends.

For example, look at the count of average rigs in operation. The tally dropped dramatically in 2015. It has slowly been recovering since fall of 2016.

Continue reading “Swings in oil prices and rig count in North Dakota”

Oil production in North Dakota up 5% in February 2017

Illustration why Bakken and Eagle Ford are a strategic threat to OPEC. Photo by James Ulvog.

Oil production in North Dakota increased 5.38% in February to 1,034,168 bopd (preliminary). This follows a 4.14% increase in January. Two large changes in earlier months were an 8.91% drop in December 2016 and a 7.31% increase in October 2016.

I’ve not posted my usual graphs for a few months. Will get caught up in the next few days.

Here is a graph of average daily production, both state-wide and Bakken-only:


Here is a longer term view, with average daily production since 2004:

Continue reading “Oil production in North Dakota up 5% in February 2017”

Recent counts of drilling rigs in North Dakota

Drilling rig at dawn. Photo by James Ulvog.

The count of drilling rigs in operation across the state has shown strong increase since fall ’16.

Here is a recap of the North Dakota rig count, all from Million Dollar Way. It has been a while since I posted an update.

Keep in mind that the dramatic increase in productivity and production per well means that the number of rigs isn’t anywhere near as important as it was several years ago. At the same time, the count of rigs is still one indicator of activity. Perhaps the long-term trends aren’t important while the shorter term trends are.

Keep in mind I gather data when I think to make notes on the count. Also, I haven’t double checked the numbers, so there very well could be some errors.

Continue reading “Recent counts of drilling rigs in North Dakota”

Updates on Bakken

Gotta’ get that well back in production. Crew on workover rig working well after dark. Photo by James Ulvog.

Here are four articles providing a bit of background on what’s going on in Bakken.

You have likely noticed I have long relied on The Million Dollar Way for my education on oil in general and Bakken in particular. Just look at the source for the following four articles. That makes it sorta’ cool when on 3/22 MDW recommended my post Scratching my head at the geopolitical impact of fracking. Thanks for the mention!

2/19/17 – The Million Dollar Way – EURs – Bakken 2.0 – EUR means Estimated Ultimate Recovery, which is the total amount of oil expected to be extracted from one specific well.  Article says the EURs in Bakken were 300K early on. At the point I started paying attention, the EURs were in the 500K range with possibilities of 1,000K.

Article says Mike Filloon has been talking about 1.5M instead of 1.0M.

Now the article lists 14 wells with EURs of 1.5M up to 2.0M EURs.

Continue reading “Updates on Bakken”

Scratching my head at the geopolitical impact of fracking

That little ol’ thing, along with 500 similar contraptions, is changing the world of oil production. Photo by James Ulvog.

Looks like we are in the midst of radical change in regional and world politics caused by the technological revolution in oil and gas production. I keep trying to wrap my little brain around what is going on. Here are a few articles that may stretch your brain too.

  • Brain stretcher on the shift in geopolitics due to increased US oil production
  • Speculation why the Saudi government’s plan to re-engineer their country’s economy isn’t going to work
  • Three articles on the rapidly increased US shale production undercutting the OPEC production cut

3/12/17 – PJ Media – The Problem of Success – Article raises the unsettling idea that nobody has figured out the impact of dramatically increased production in the US.

Neither the previous US administration, the current US administration, leadership in Saudi Arabia, leadership elsewhere in the Middle East, nor even pundits for that matter, have figured out how geopolitics will change as Saudi Arabia loses its role as dominant oil producer and the decentralized American drillers gain the swing producer role.

It stretches my brain even to understand there is an issue.

American frackers used the dramatic run up in oil prices to $100 as an opportunity to figure out how to frack oil where it could never have been touched before. They then used the collapse in prices as an opportunity to figure out how to frack far more efficiently, far more effectively, with far higher production output from every well. As a result, the break-even price for U.S. shale has shrunk.

The vast network of independent producers are responding to price changes far faster than OPEC could handle or the majors could ever dream of. Prices go up somewhat and in about three months US production is surging.

Continue reading “Scratching my head at the geopolitical impact of fracking”

What Peak Oil? I’m having trouble keeping up with all the billion barrel finds.

15 wells on 1 pad. Notice a drilling rig on right edge of view. September 2015 photo by James Ulvog.

Yeah, I’m still new to this effort of watching the energy field. One of the things that still amazes me is the frequency with which the geology wizards find another billion or so barrels of recoverable oil that ‘we’ didn’t know about and a decade ago couldn’t get out of the ground profitably even if the wizards had known for sure it was there.

3/9/17 – E&P – Repsol, Armstrong Strike Big Oil Find in Alaska’s North Slope – The two companies announced a find in the Nanushuk Play with 1.2 billion barrels of recoverable oil. Two wells confirm the find.

First production is expected in 2021, four years from now. Production level expected to hit 120,000 bopd, or 43.8M barrels a year.

Oh, what Peak Oil?

By the way, I’m having a hard time keeping track of all these massive new finds of oil which either nobody knew about a decade ago or it would have been technically impossible to ever get any of it out of the ground.

Continue reading “What Peak Oil? I’m having trouble keeping up with all the billion barrel finds.”

Increasing employment in Bakken?

Workover rig, immediately north of Williston. Photo by James Ulvog.

Update:  Greetings to readers arriving from The Million Dollar Way! Enjoy! Oh, by the way MDW, you are very welcome.  For other readers, if you enjoy my writing on energy in general, Bakken in particular, and the wide open frontier of the energy revolution, somewhere around one-quarter of the credit for what I know goes to the learning provided by MDW.

I’ll make a guess we will be hearing lots more stories of hiring in Bakken. Some recent articles:

  • Two articles on oil companies hiring fracking crews
  • Scuttlebutt is staffing shortages to develop
  • Two articles on Target Logistics converting crew camp into hotel

12/29 – Grand Forks Herald at Dickinson press – Oil companies hiring fracking crews in Bakken – Job Service North Dakota said there are 60 companies wanting to staff up fracking crews. Each crew will need between 45 and 65 workers, so that something in the range of 300 or 350 jobs in the new year.

Let’s extend that out. The Million Dollar Way helps us in a post asking Worker Shortage Looming In The Bakken on 12/30.

It takes about two or three days to frack a well. Assume two wells per crew per week. That would be 12 wells a week for 6 crews, or somewhere around 48 wells in a four-week month. Keep in mind that’s on top of whatever fracking crews are in the field now.

Continue reading “Increasing employment in Bakken?”

Oil production in North Dakota drops 1% in November

daily-output-since-2008-1-17

Above graph shows the average daily production in North Dakota statewide and in the Bakken field. Output in November dropped to 1,033,693 bopd from October production of 1,043,318 (revised), a change of 9,625, or down 0.92%.

Mr. Lynn Helms has some observations, reported by Amy Dalrymple, ND Oil Production Stays Above 1 Million Barrels in November.

Continue reading “Oil production in North Dakota drops 1% in November”

EPA study: fracking doesn’t contaminate ground water.

Illustration shows the concept but distorts the proportion. Water is usually 500 or 1500 feet down. Drilling is usually 10,000 or more feet underground. That leaves somewhere around 8,000 or 10,000 feet of solid rock separation. Image courtesy of Adobe Stock.
Illustration shows the fracking concept but severely distorts the proportions. Water is usually 500 or 1500 feet down. Drilling is usually 10,000 or more feet underground. That leaves somewhere around 9,000 feet or more of solid rock separation. Distance between oil and water is about 9 times the distance between the water and the surface. Image courtesy of Adobe Stock.

The EPA spent millions of dollars and five years looking for some evidence that fracking causes contamination of ground water. They only found isolated indications of contamination, nothing widespread, and nothing systematic. Yet their report suggests otherwise.

12/13 – The Daily Caller News Foundation – EPA Says There’s No Evidence Fracking Contaminates Groundwater – The EPA spent five years, working with environmental groups, trying to find evidence that fracking causes contamination of groundwater. Even with five years of effort they could not find any evidence or indication of serious risk, only a few isolated incidents.

In spite of that, EPA withdrew a comment from the previous report that there’s no evidence that fracking causes contamination. The reason they withdrew their comment in spite of not been able to find any evidence? They can’t prove the negative that it doesn’t cause contamination.

Continue reading “EPA study: fracking doesn’t contaminate ground water.”

14 wells on one site southwest of Williston, the Atlanta wells – part 2 of 2

14 well pad next to Missouri River with Williston in distance. Photo by James Ulvog.
14 well pad next to Missouri River with Williston in distance, looking northeast. To find the pad, look for the light horizontal patch to the left of the bridge after the road crosses the left side of the river. Photo by James Ulvog.

Previous post described a well pad southwest of Williston that holds 14 working wells. These are referred to as the Atlanta wells.

I got some great pictures of the site from the air and from the ground on my recent trip to Williston.  Million Dollar Way just updated the production information for the 14 wells. So, decided to bring all that info together.

If you want to find this mega-producer, the address is 4750 141st Ave. NW, Williston. If you want to drive there, be advised the road off the 85 shown on Google maps isn’t there anymore. You will need to take a nearby side street. Coordinates are 48.109623, -103.729930 if you want to look them up on Google maps.  The pad is north of the Missouri River and west of the US 85 bridge over the river. 

Statistical data

The Million Dollar Way has been following these wells for several years. Check out this post for background and production data:

Here is some statistical data for the wells.

Continue reading “14 wells on one site southwest of Williston, the Atlanta wells – part 2 of 2”