Best 2014 energy graphs from Carpe Diem

???????????????????????????????

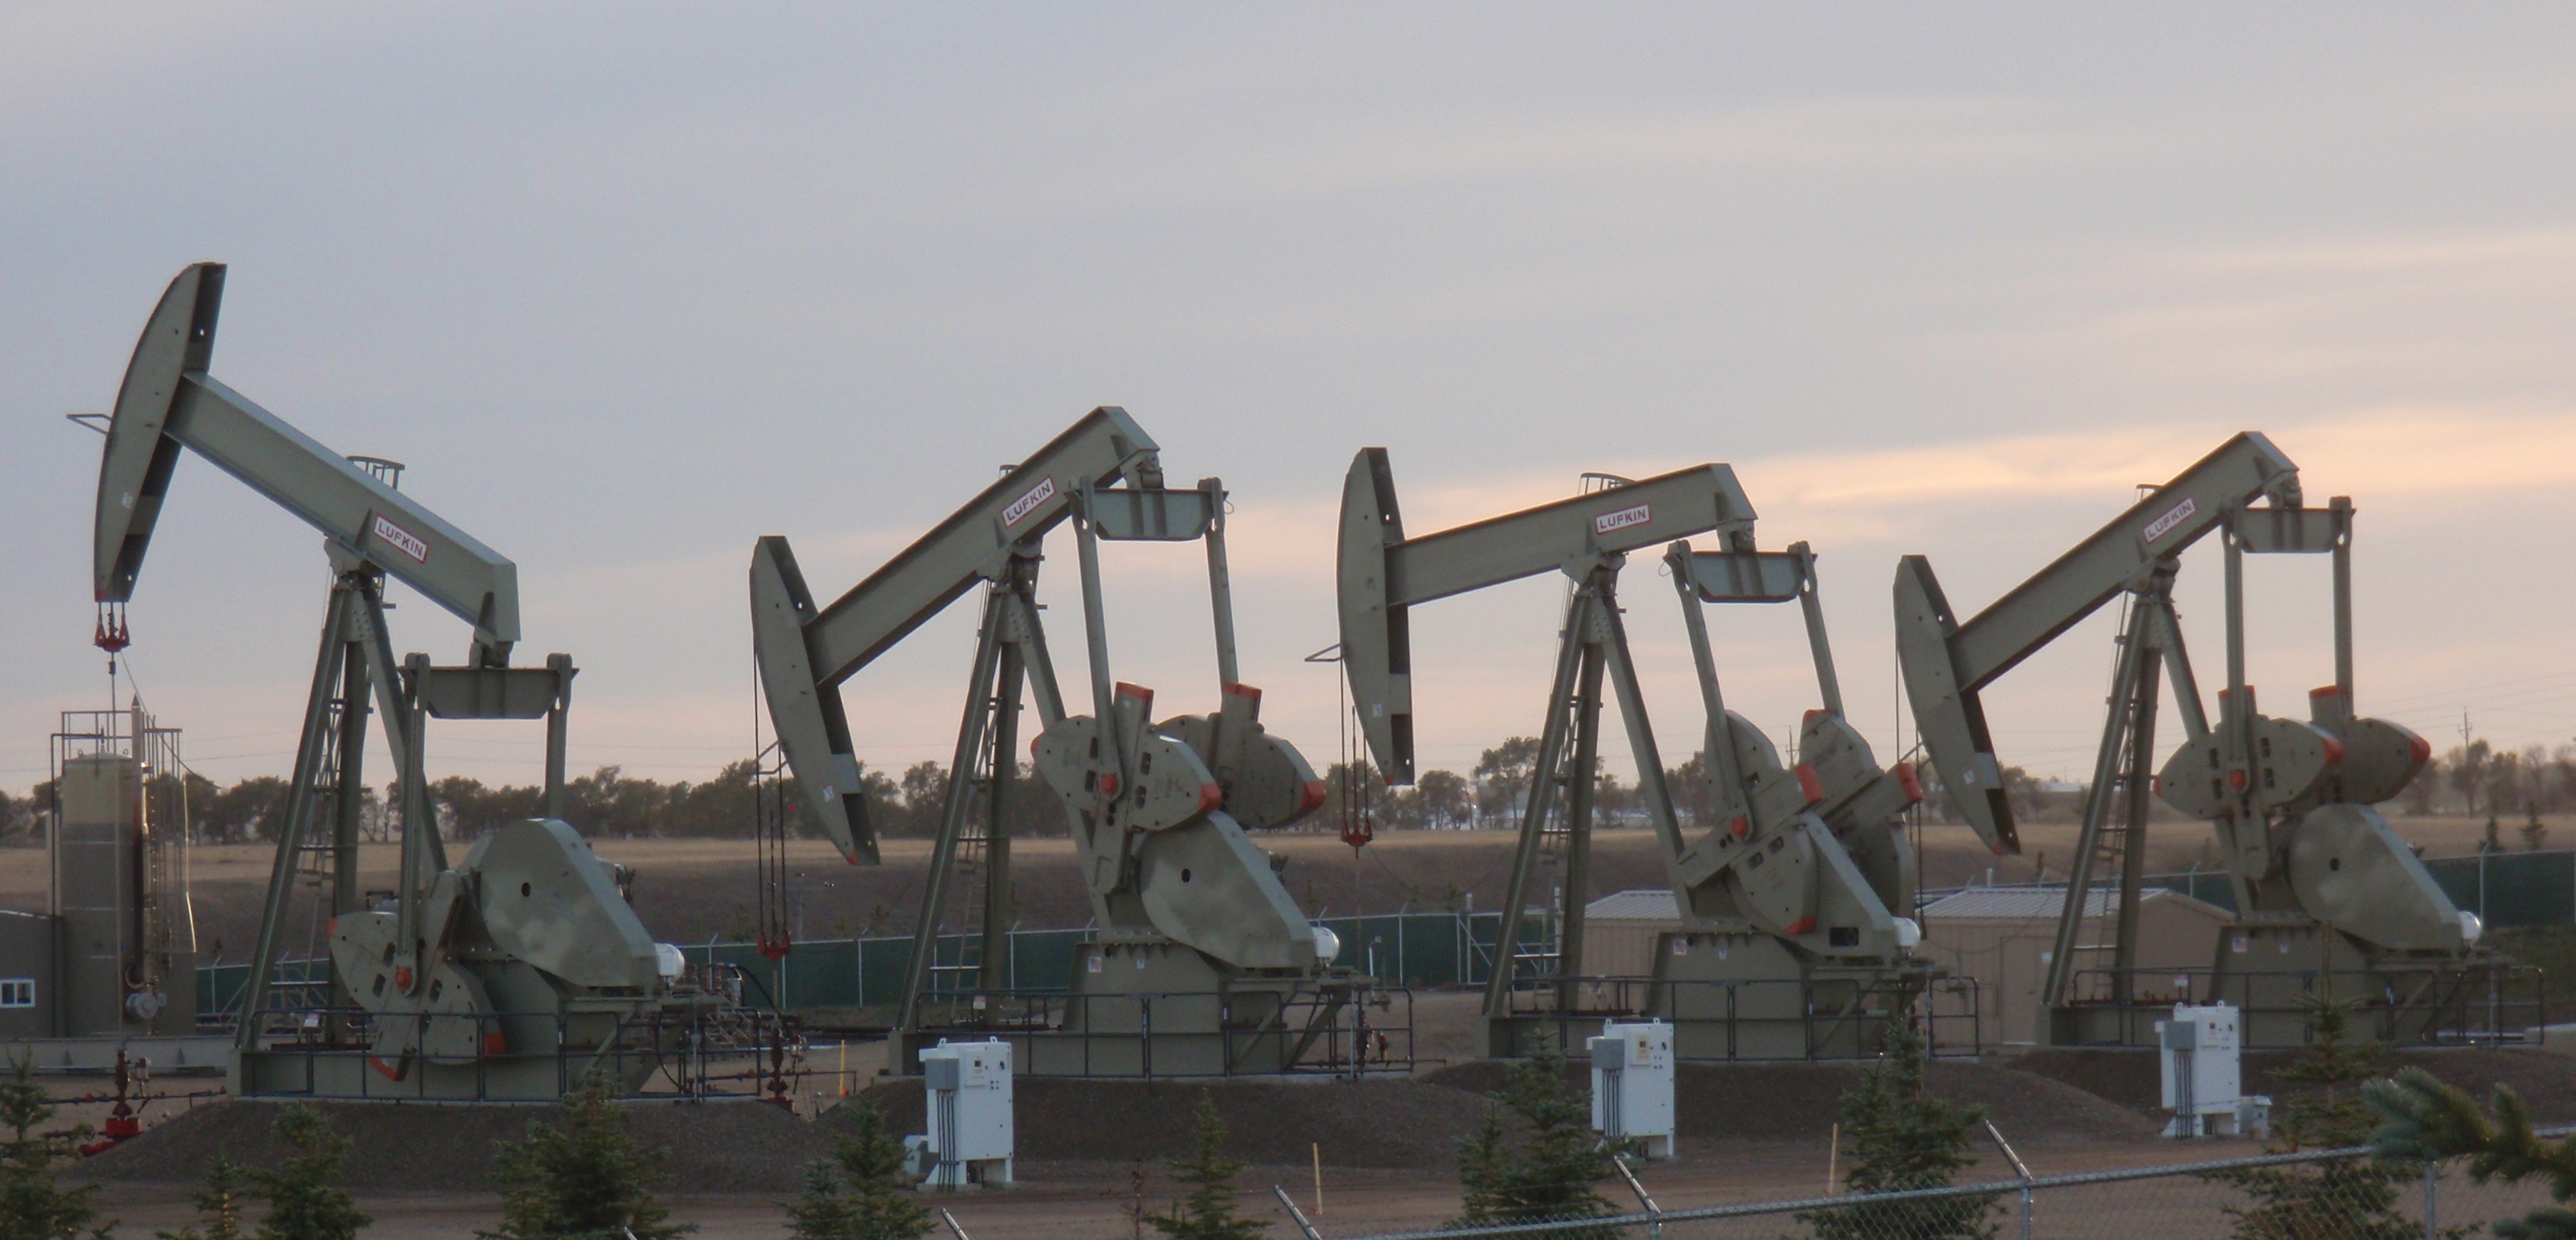
(Photo by James Ulvog)

Carpe Diem has been running a recap of the best-of graphs from 2014. Last week the focus was energy:  My Top Ten Energy Charts of the Year For 2014.

Here are some of my favorites.  All graphs used with permission of Carpe Diem.

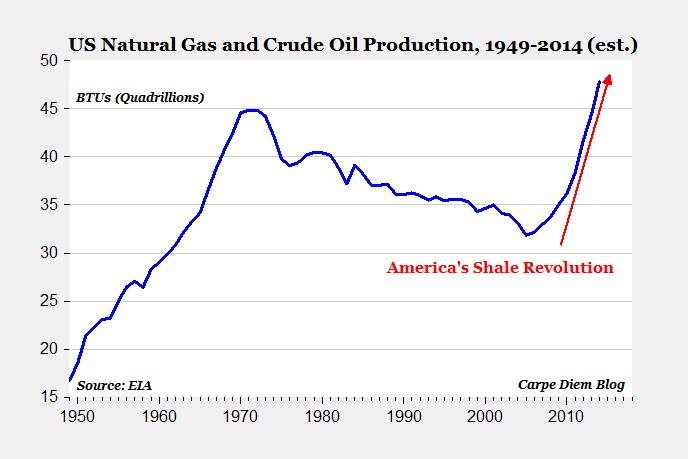
If you have just tuned into the energy revolution, look at these graphs to see how much things have changed in the last decade.

Check out the total U.S. production of crude oil and natural gas. That is a great proxy for the shale revolution.

energy gas and crude

Look at the crude oil only production graph. Continue reading “Best 2014 energy graphs from Carpe Diem”

Bakken and Eagle Ford in the elite of super-giant oil fields

[youtube=http://youtu.be/0ks2ua4imgU]

Production of Bakken oil in North Dakota will soon hit one million barrels a day. When it does, it will be one of only 4 fields in the U.S. to hit that level. Those 4 are part of an elite group of only 10 super-giant fields.

Applying some new trend analysis concepts, the EIA is predicting Bakken production will be 976K bopd in 11-13 and 1,002K bopd in 12-13.

I’m not sure if that estimate includes production from legacy wells. Even if it does and we back out September production of 65K bopd that only changes the date of crossing the 1M point by a month or so. That doesn’t matter for purposes of this discussion.

Their calculation shows Eagle Ford has already passed the 1M point. Permian production has been over the 1M point (again?) for a while and is at an estimated 1,340K bopd in December.

Along with Prudhoe Bay that makes four American fields that passed the 1M point.

Continue reading “Bakken and Eagle Ford in the elite of super-giant oil fields”