Somewhere around $60 by December is Harold Hamm’s prediction. If such a comment wasn’t from Mr. Hamm, I would have ignored the article.
Main coverage is at Wall Street Journal: Continental Resources CEO Sees Oil Prices Doubling by Year End. He thinks Saudi Arabia made a serious mistake by pumping so much oil. That pushed prices way down. It also moved the US to allow exporting crude oil.
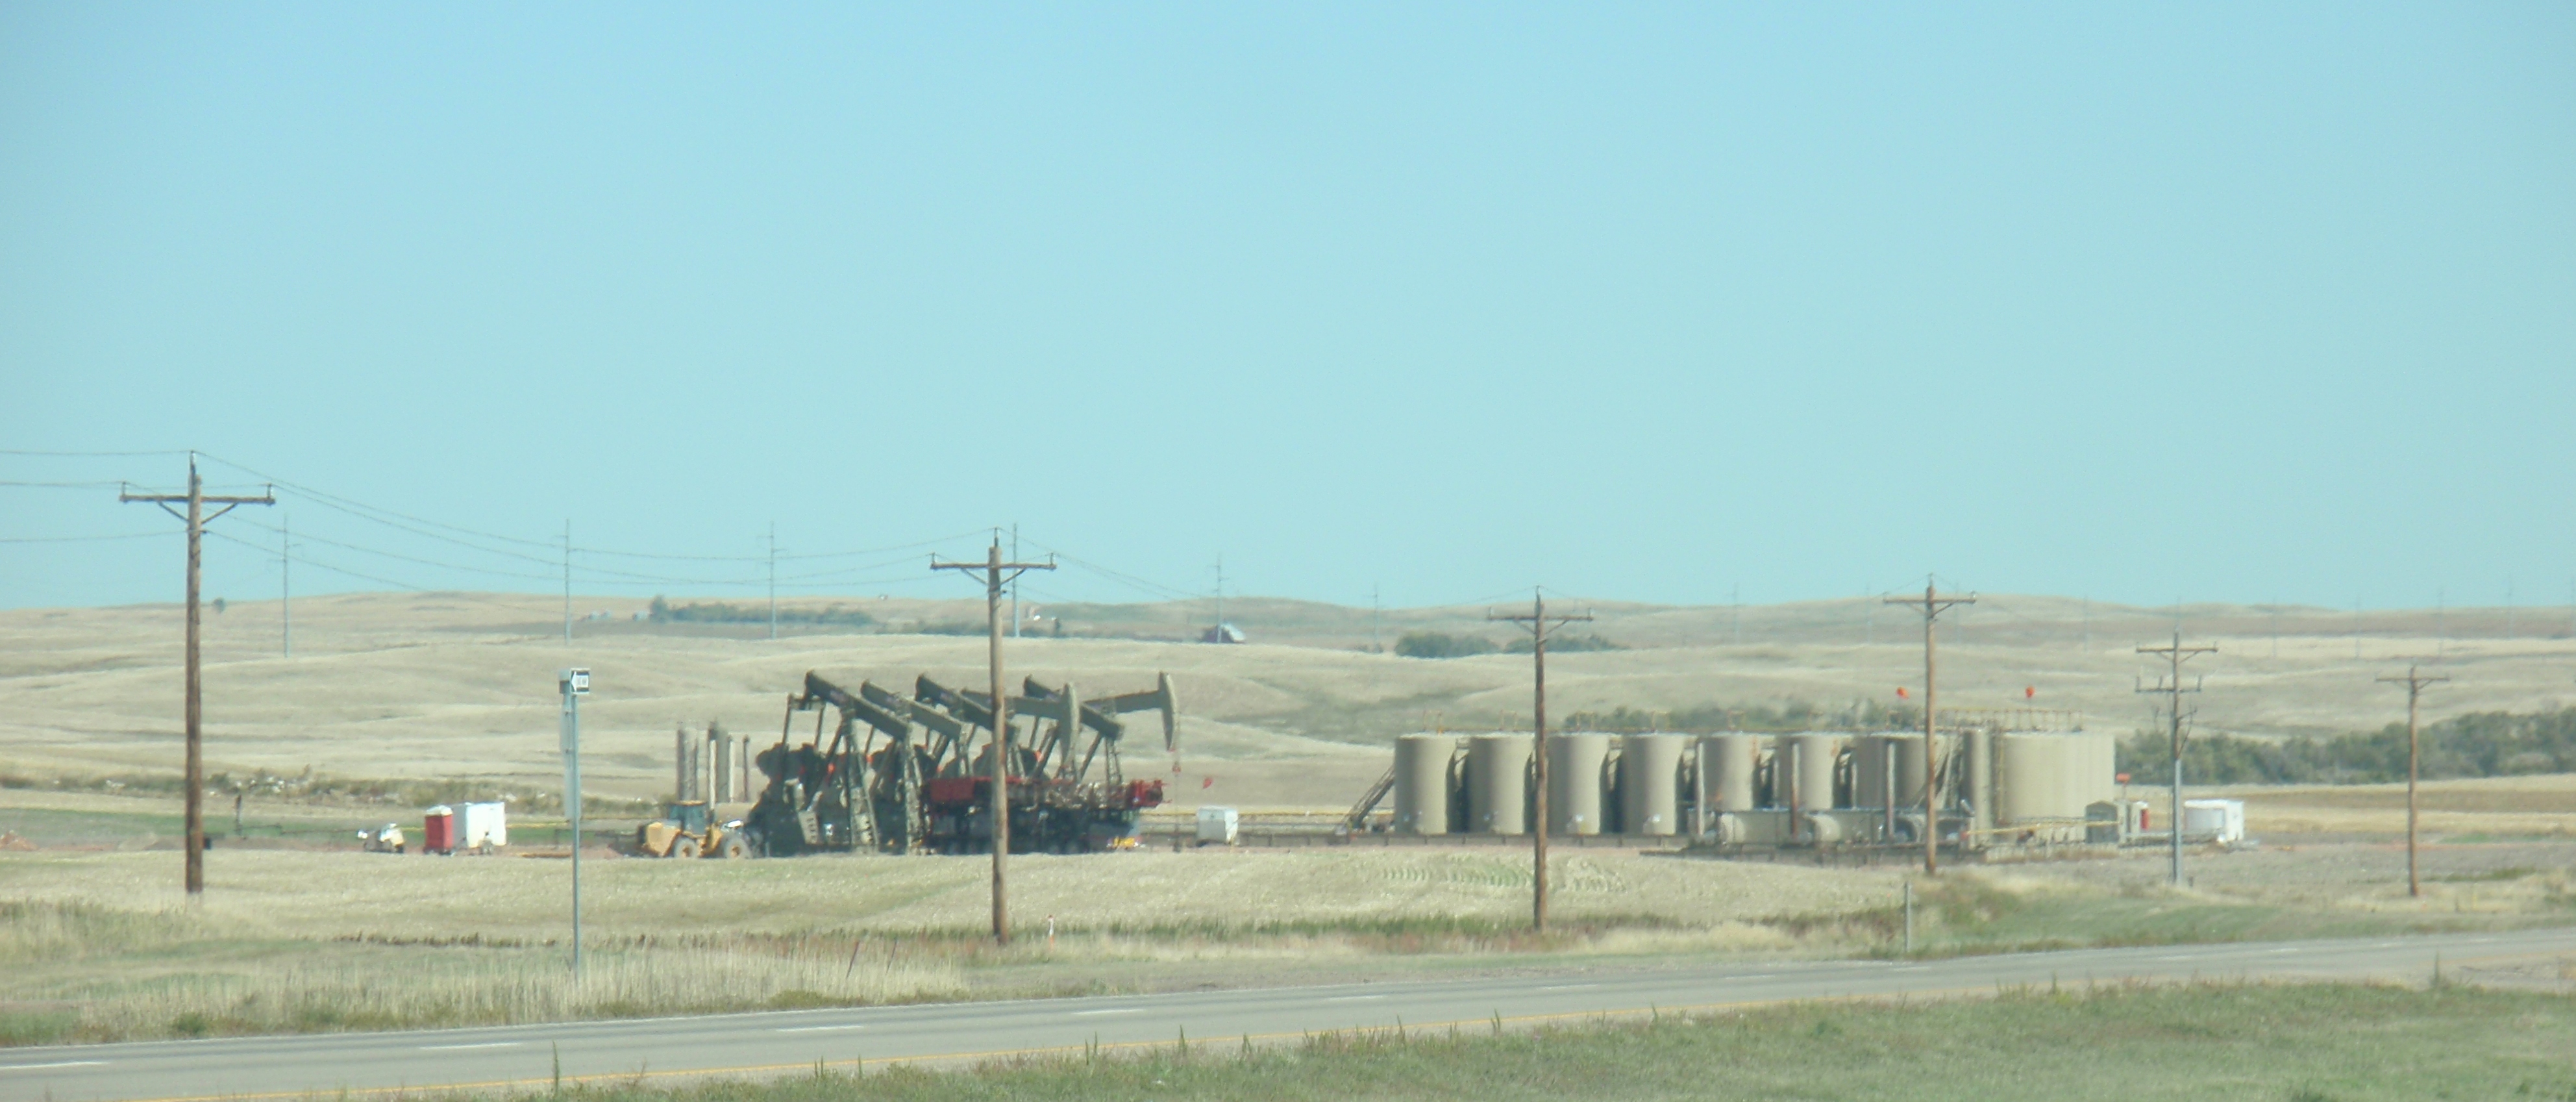
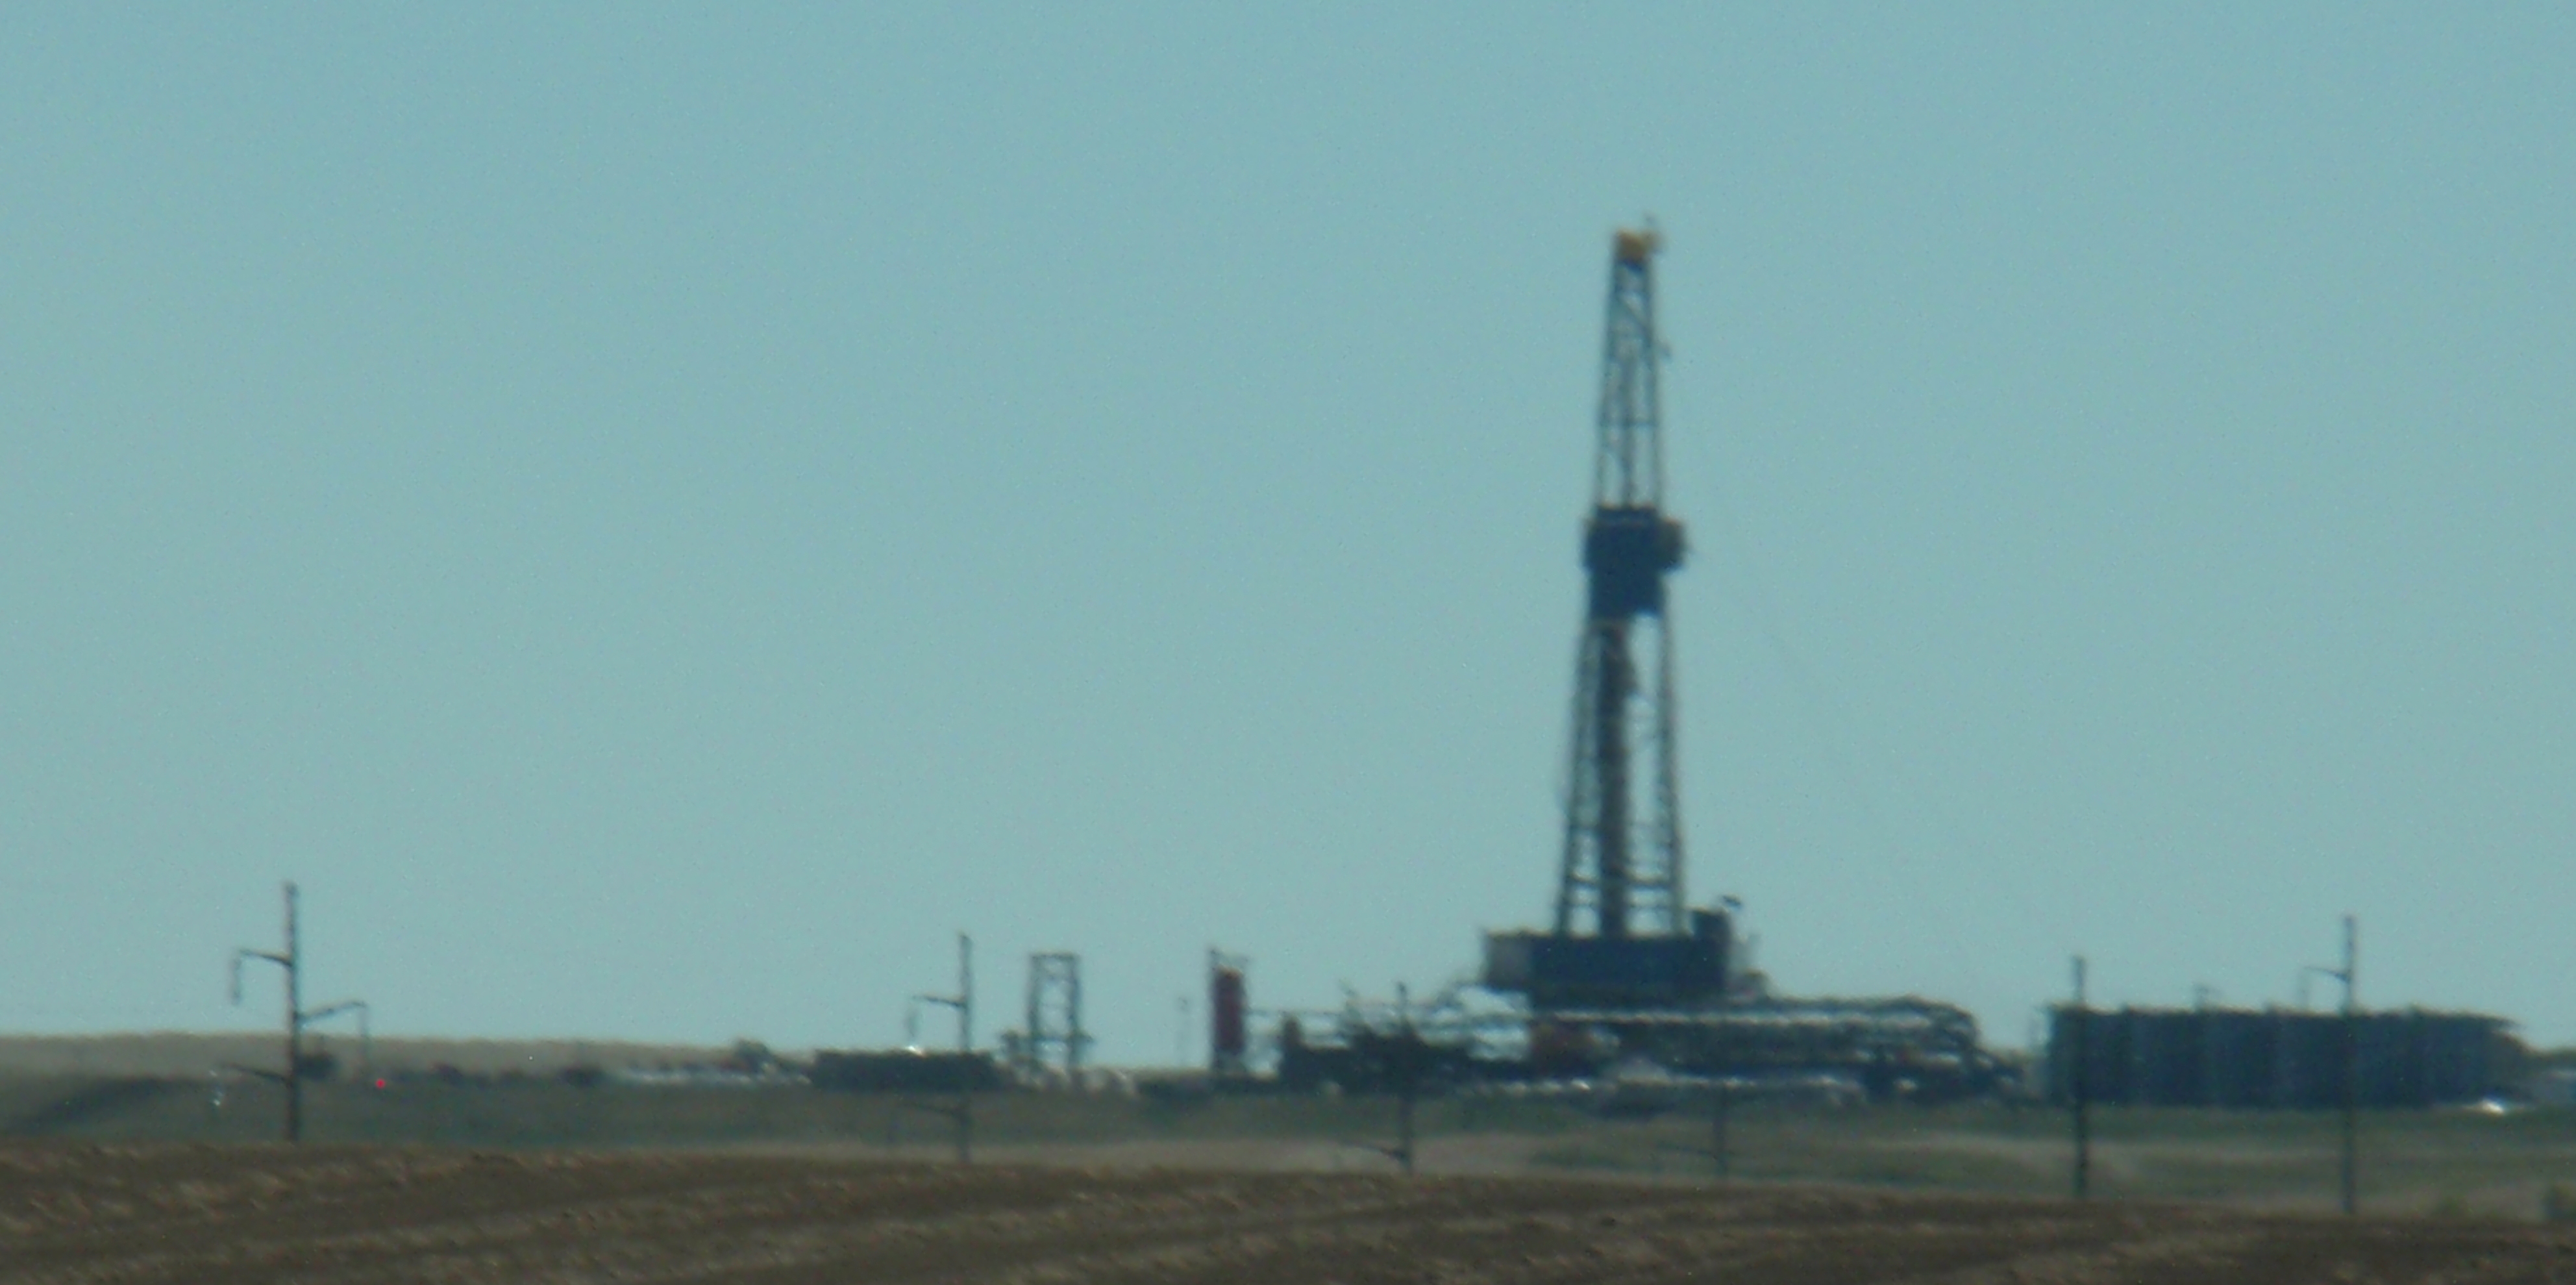
I estimate there are 42 storage tanks on this pad. There will be far more than 6 wells at this site by the time all the drilling is done. Photo in September 2015 by James Ulvog.
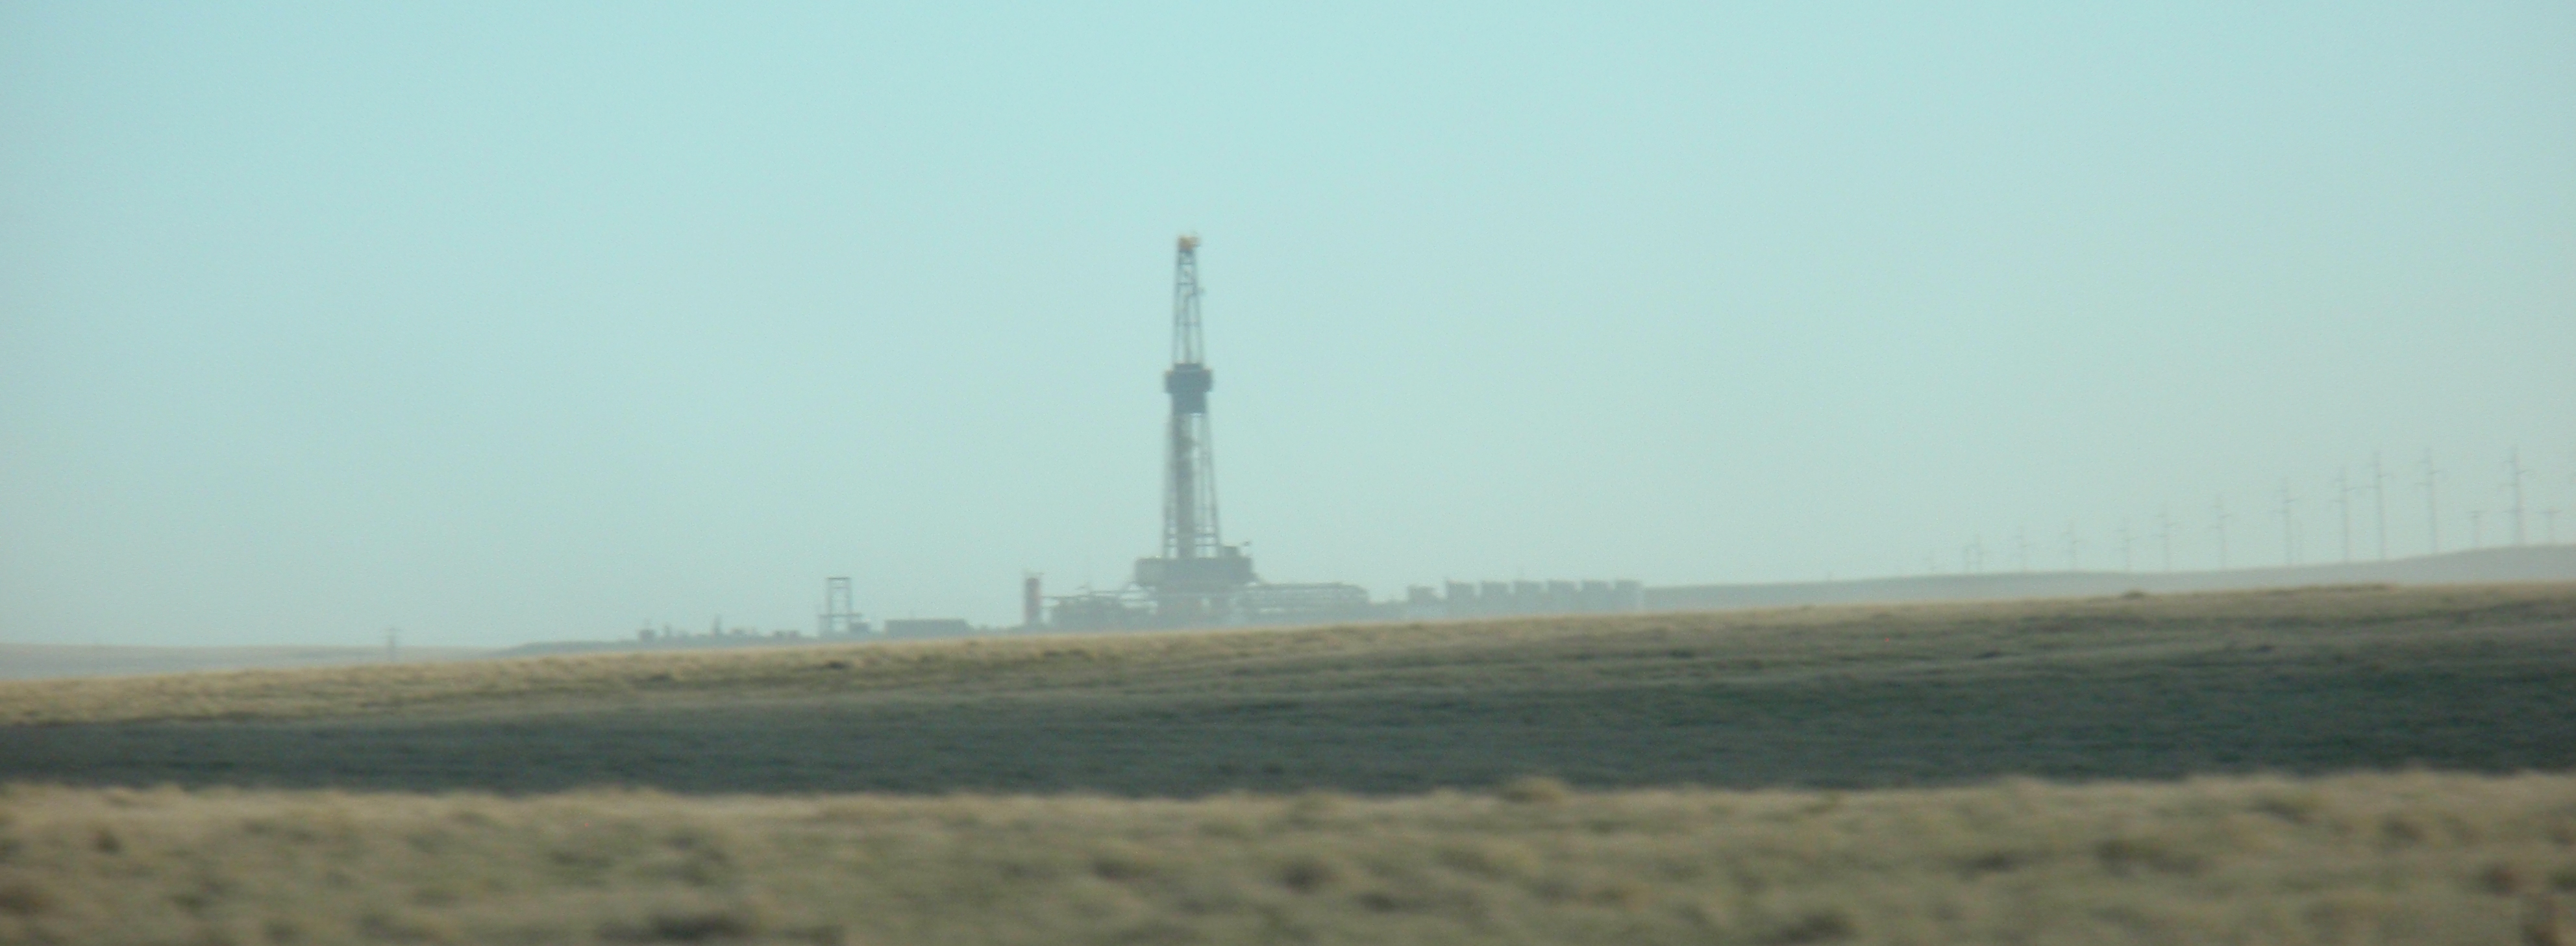
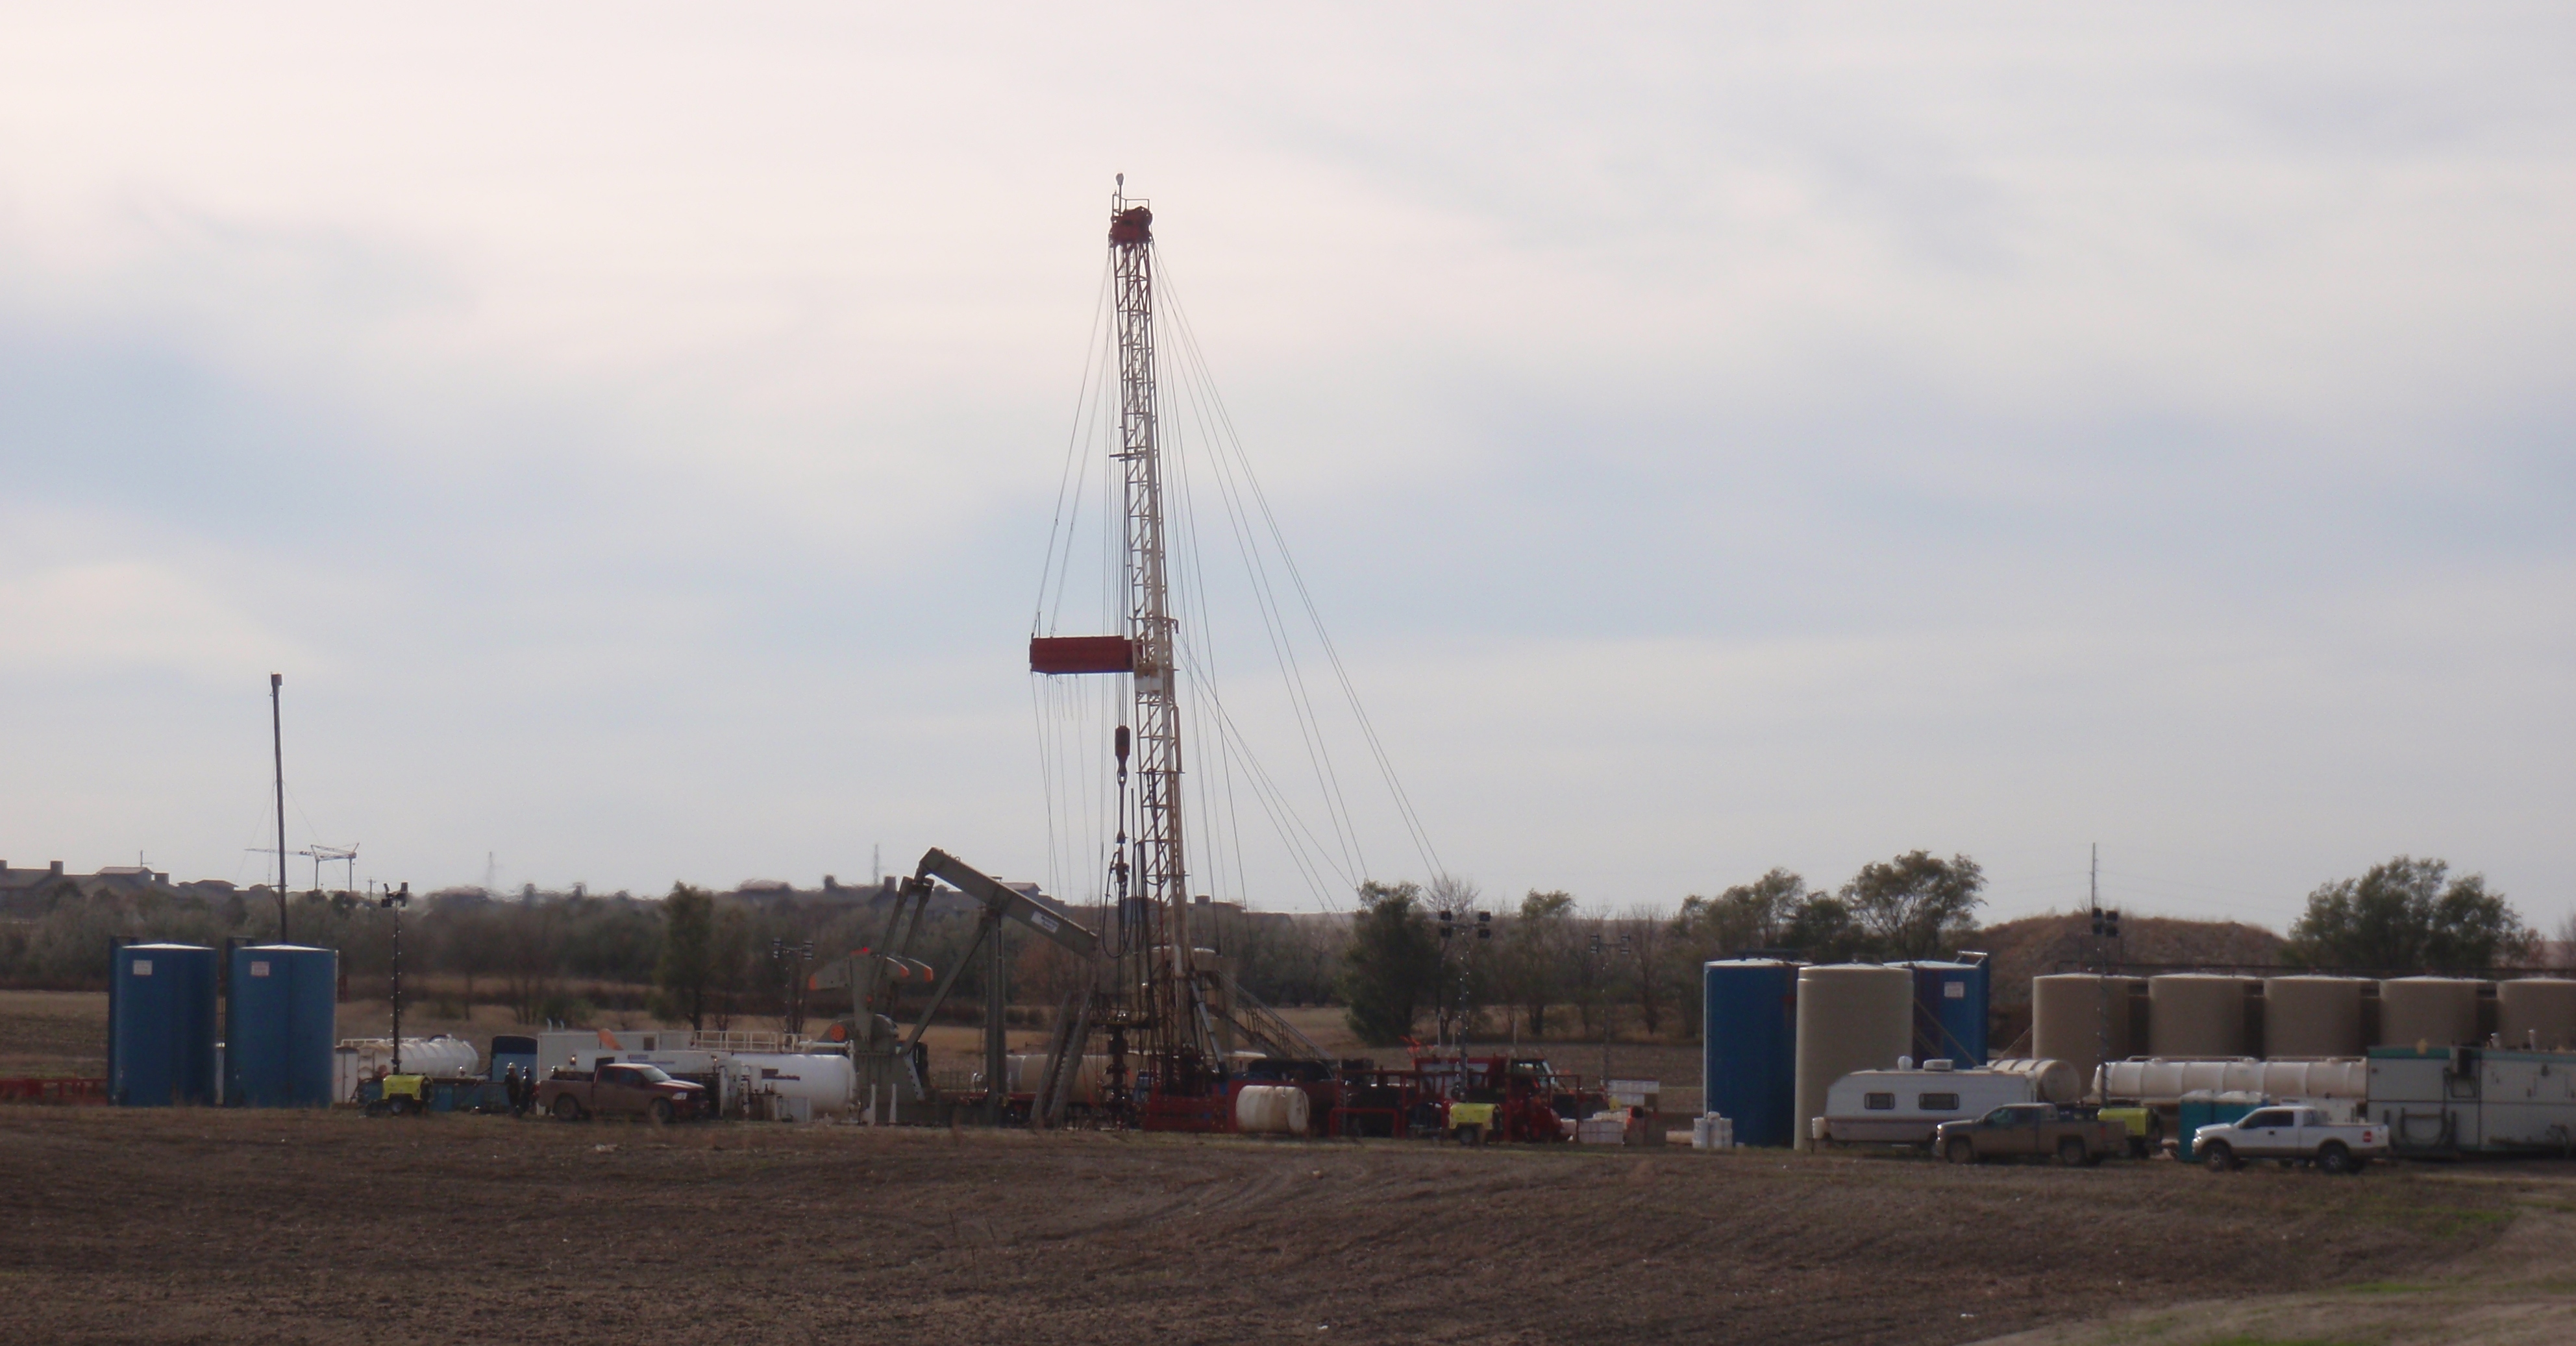
Take a look at these indicators of what is going on in the state. Does this look like a collapse to you? Or does this look like a return to something that resembles a normal growth market?
Ariane 5 liftoff for VA227 launch. Credit: Arianespace.
One of the major reasons I blog is to learn. Nothing stretches me more than reading a fascinating article and commenting in public on it. Putting my thoughts out on the never-to-go-away Internet requires a very careful reading of articles.
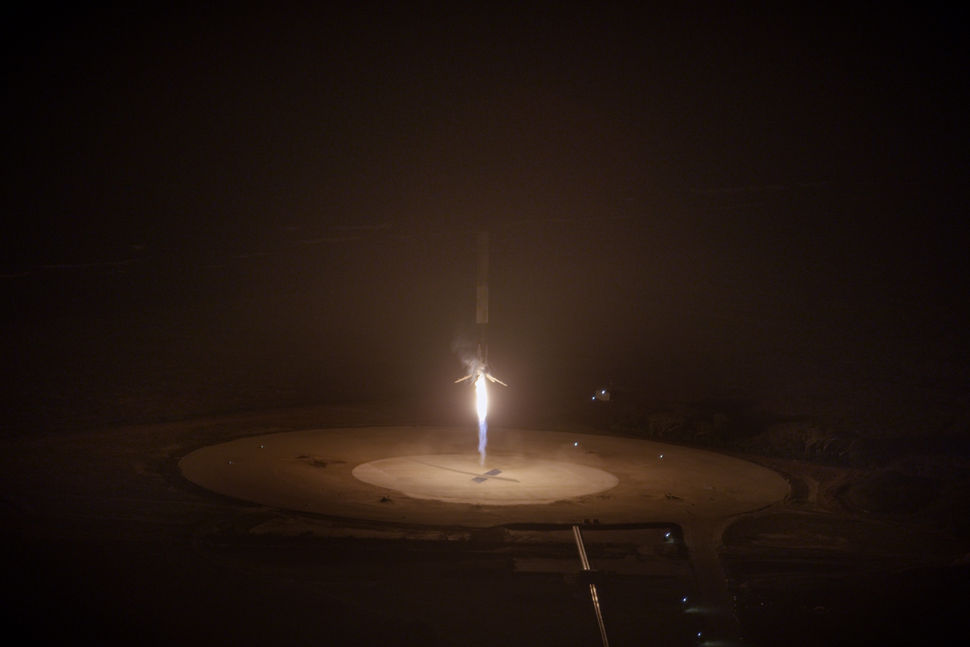
The organization’s CEO provided the following count of commercial orders for 2014. I think this is the count of launches into geo-stationary transfer orbit:
9 – Arianespace
9 – SpaceX
Article says that reflects Arianespace catching up with SpaceX.
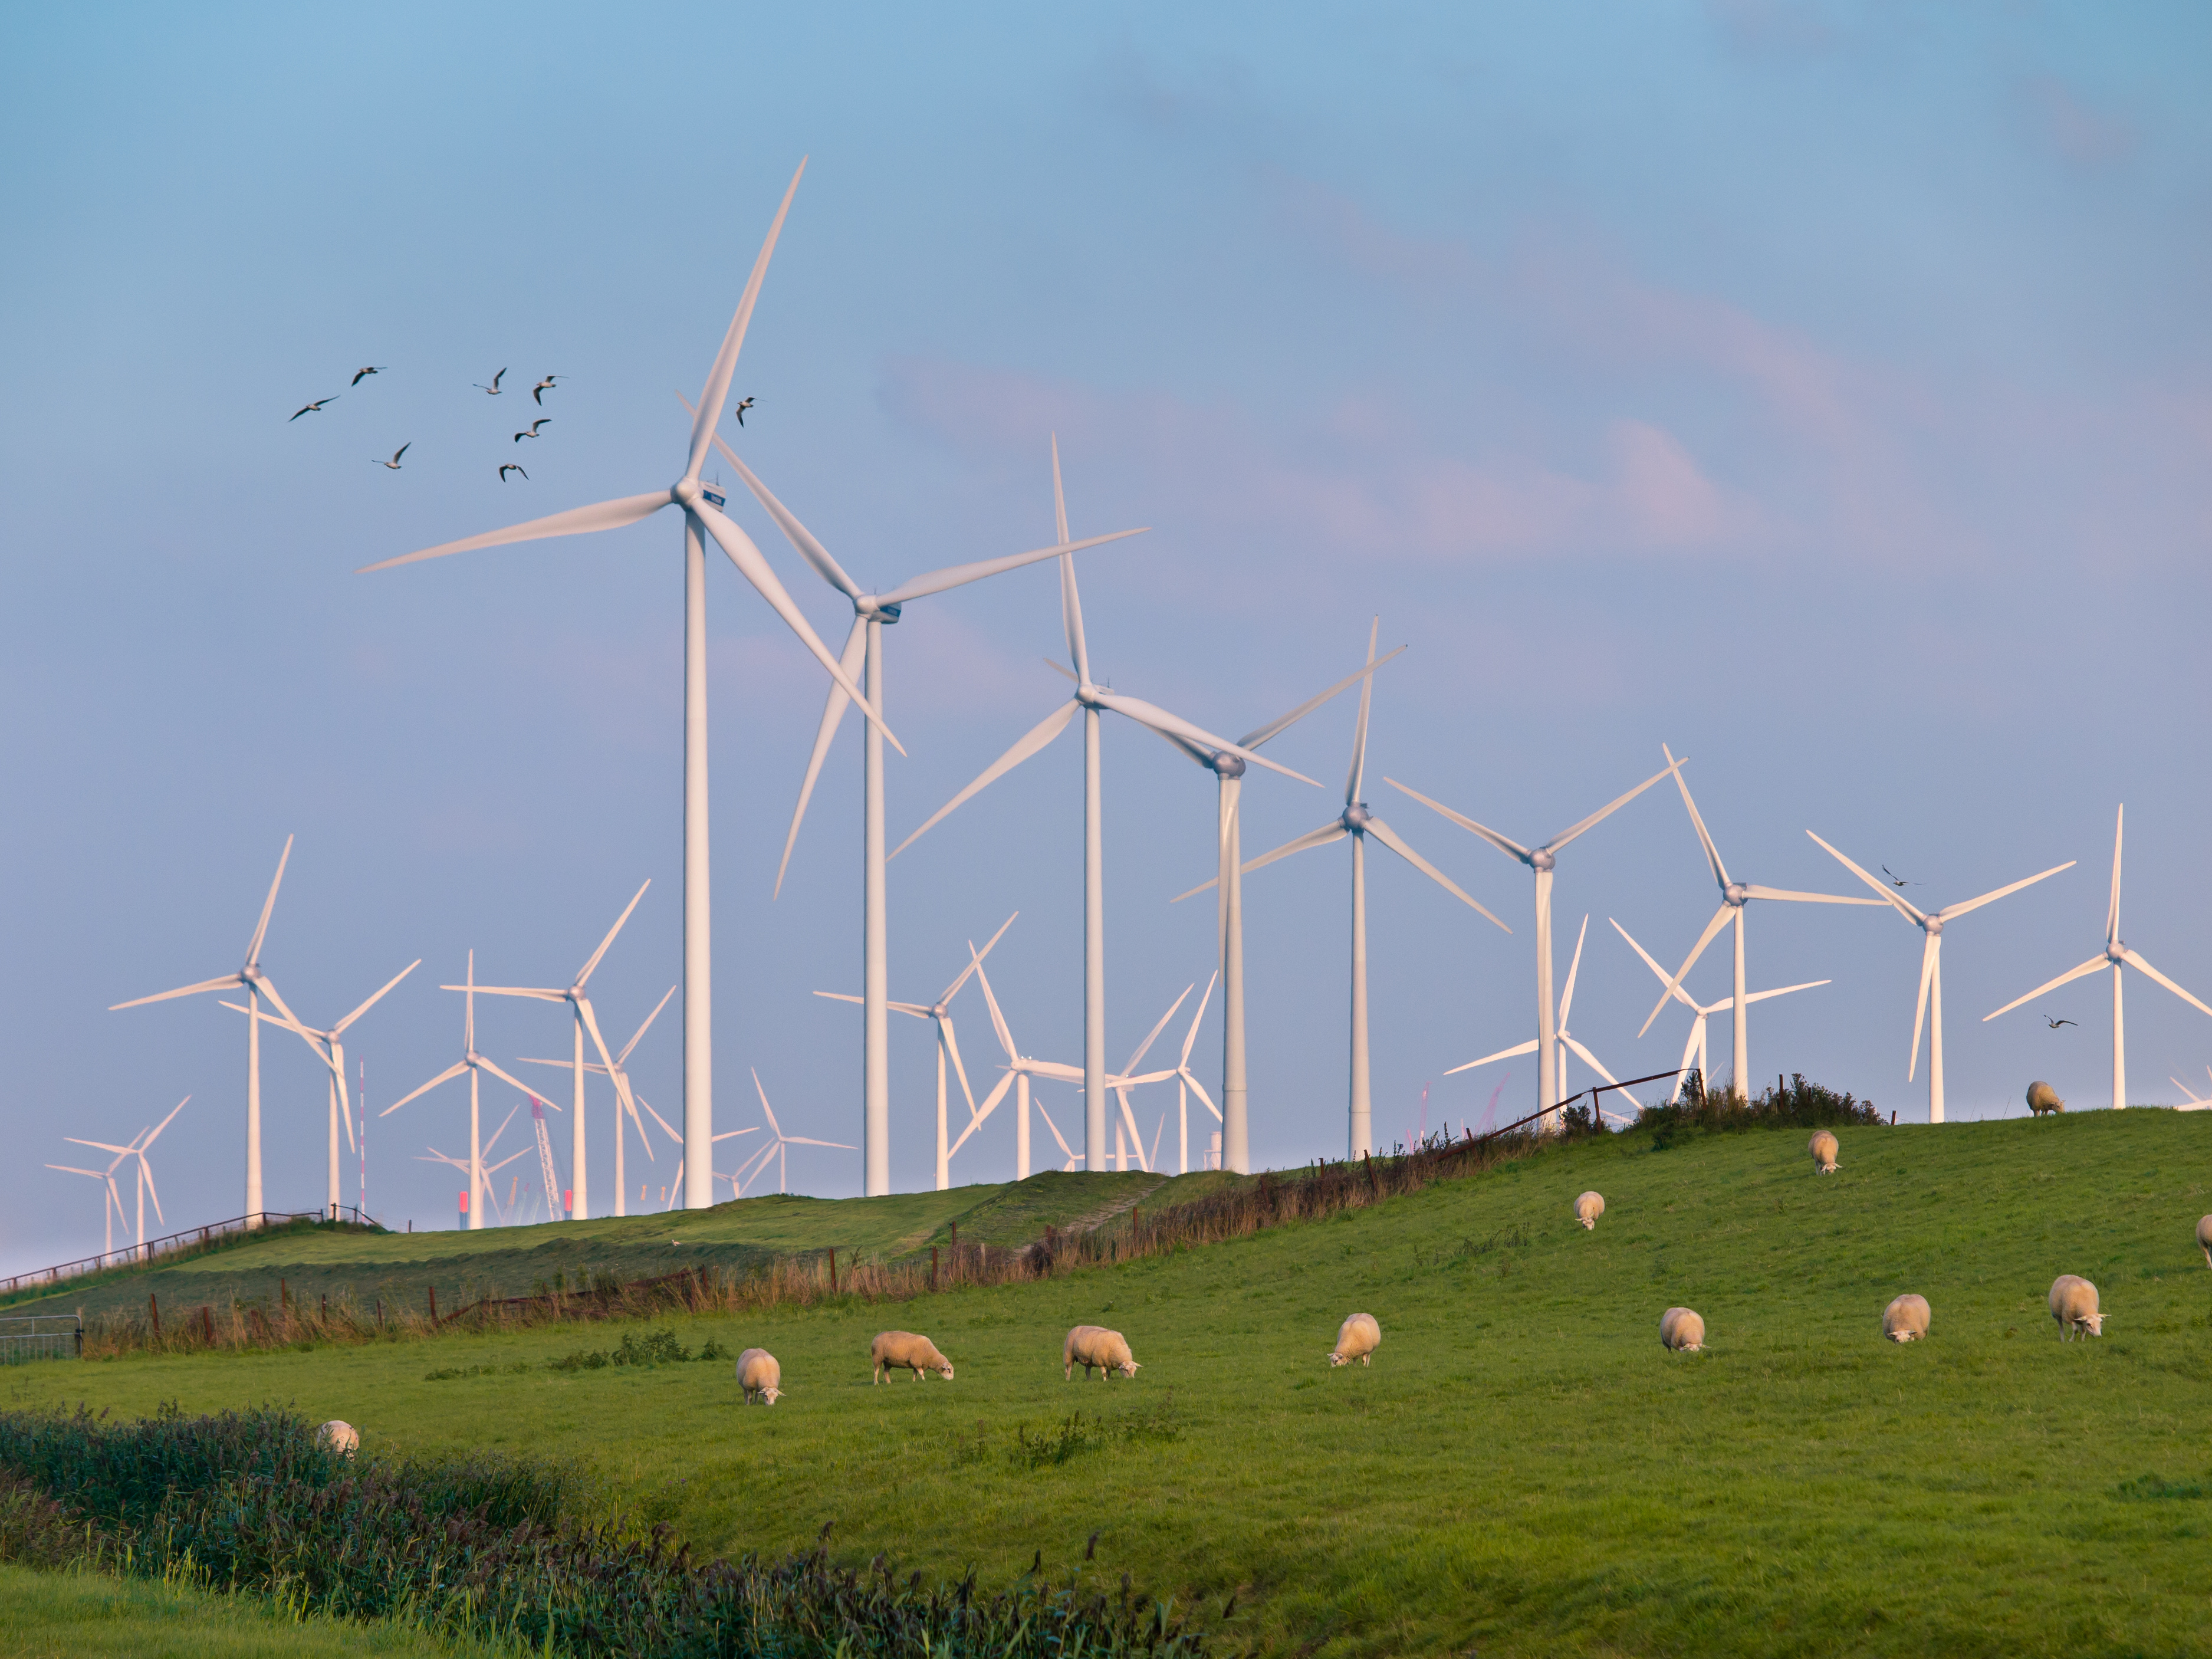
Birds that are at risk of finding out why turbines should be called slice-and-dicers. Pictures courtesy of DollarPhotoClub.com.
The Million Dollar Way quotes a press release from Montana-Dakota Utility without a link. MDU has purchased the Thunder Spirit wind farm project from Allete Clean Energy. MDU currently has a commitment to buy all the electricity from the project on a 25 year contract. Now MDU owns the wind farm.
Project consists of 43 towers with rated capacity of 107.5 mW. Cost is reported in the press release to be $220M.
At cost of $220M for 107.5 mW, that works out to $2.05M/mW.
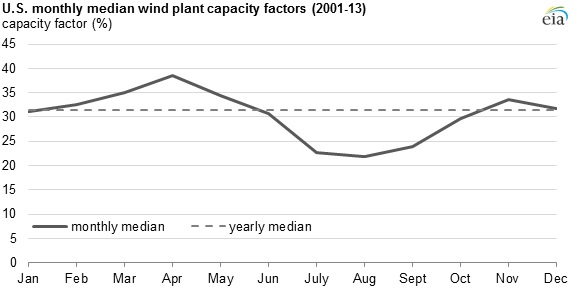
Keep in mind in the upper plains the average capacity of wind farms is about 34%. See EIA graph here. Peak is about 43% in fall and low is about 21% in the late summer for about 2 months. The upper plains have a flatter capacity curve than other regions. Looks like about 40% can be achieved for half of a year.
Theoretical output (also called nameplate) is 107.5 mW. Average output will likely be 36.6 mW (107.5 x 34%).
A lot has happened in the last few days around the Middle East, all of which news points toward more turmoil in the region and increases risks of turmoil in the oil market.
If you are really interested, follow along with me as I tried to sort things out. Keep in mind I’m blogging as a way to sort out for myself what is happening around me. So here goes…
On Saturday, Saudi Arabia executed 47 people who had been convicted for various charges. One of them was a very visible Shiite cleric. I think the death sentences have been in place for some time so there was no outwardly visible reason why those sentences were carried out over the weekend. That particular cleric has been under sentence since 2014.
Protests quickly broke out in Iran. The Saudi Embassy in Tehran was attacked and part of it set on fire. I didn’t quite understand from press coverage whether the protesters actually got into the building or how much of the building was damaged by fire. One photo shows one fire burning in one part of the building but does not give a larger context.
How fast do you suppose those drillers that scaled back could scale up? Out of focus photo by James Ulvog.
Had been planning to hold this article for a few days because of other posts I’d like to run first. Guess I’d better run it now. At the rate things are deteriorating in the Middle East, need to post it quickly before war headlines make it completely out of date.
One of several catastrophic obstacles to relying on wind power to generate a large portion of our electricity is that wind turbines only generate electricity when the wind is blowing. That makes wind power quite unreliable.
Diving further into that issue shows that the wind blows more in some months more than others and this variable capacity further varies by region.
Why is this an issue? Electricity must be generated at the instant it is needed (allowing for the time it takes for electricity to get from the generating source to your house). It cannot be stored.
Variability over the course of a year
Check out the following graph from the Energy Information Administration:
That graph, which can be found here, is in the public domain since it is government information. It shows that on average across the country during the course of a year wind facilities have an average capacity of about 32%.
I am trying to collect reference points for the cost to construct different types of facilities. Here are a few data points I’ve noticed lately and some data points I’ve mentioned before.
Remember to discount all the construction costs below by the 15% to 30% capacity rate. That means backup natural gas or coal plants are needed for the 70% or 85% of the minutes each day the facilities aren’t producing.
Offshore oil
I haven’t paid attention to offshore drilling so I’m not familiar with production levels or costs. Here is one data point I just saw: