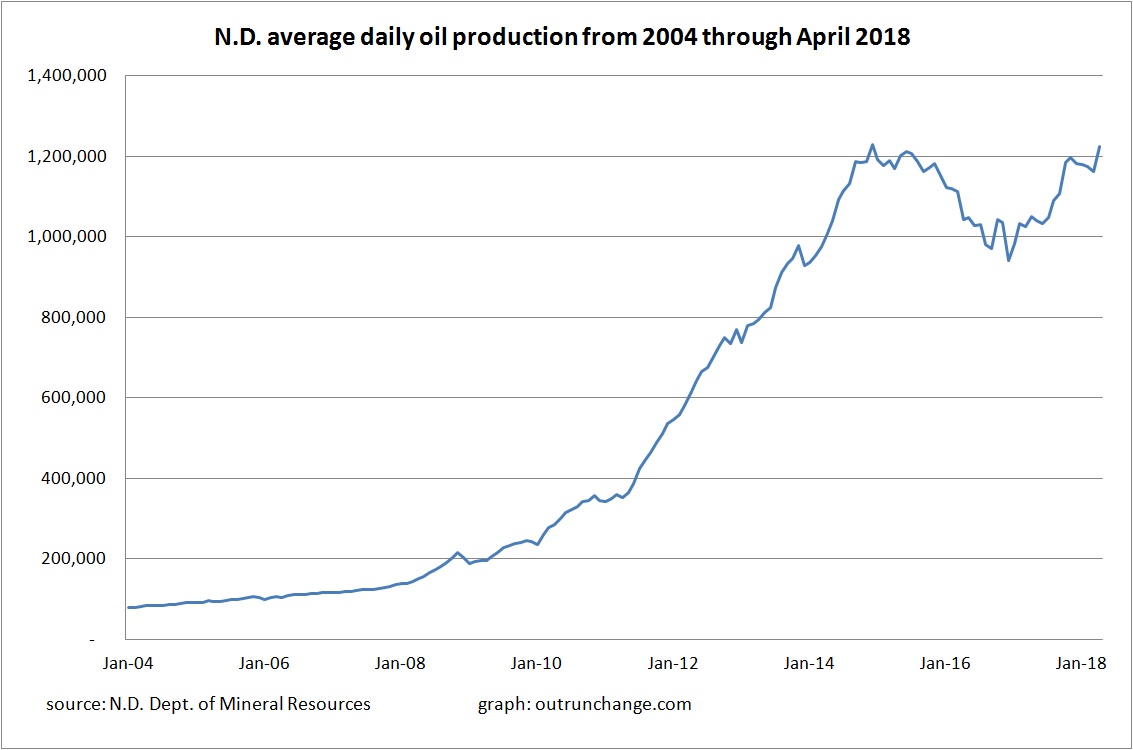
Previously discussed the near-record level of oil production in the state during April. Here is the graph of average daily production since 2004:
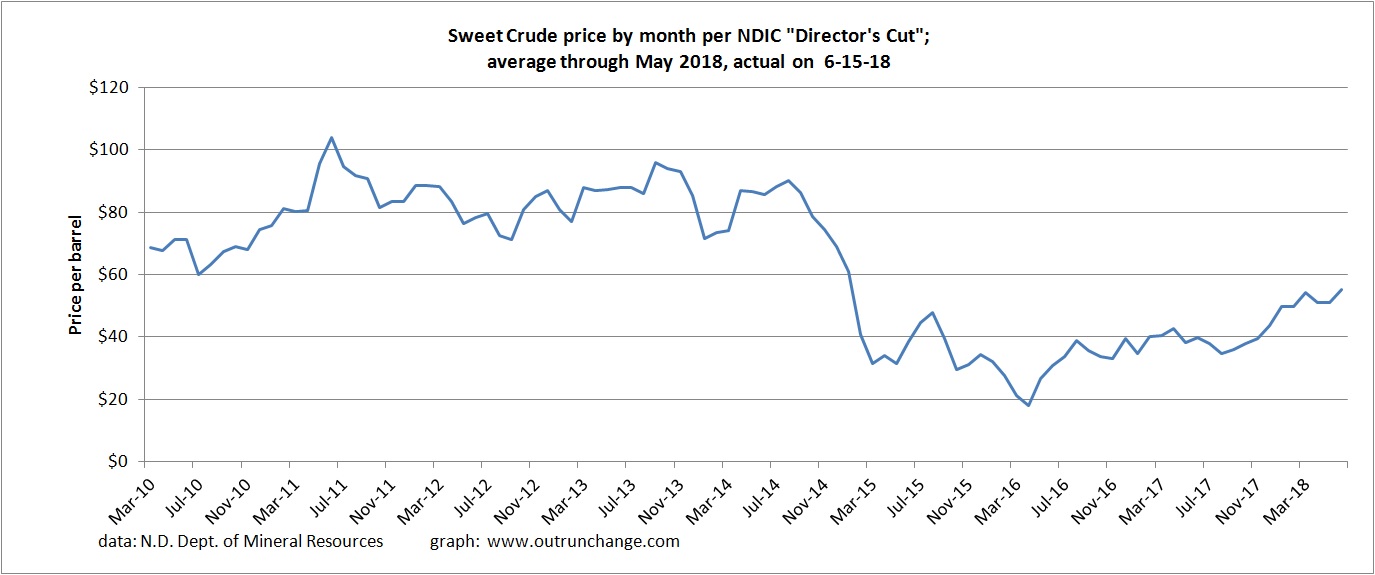
What is the value of that oil? Multiply those average daily production levels by days in the month and then multiply by the following average sweet crude prices in the state:
That gives my calculation of the value of total monthly production:
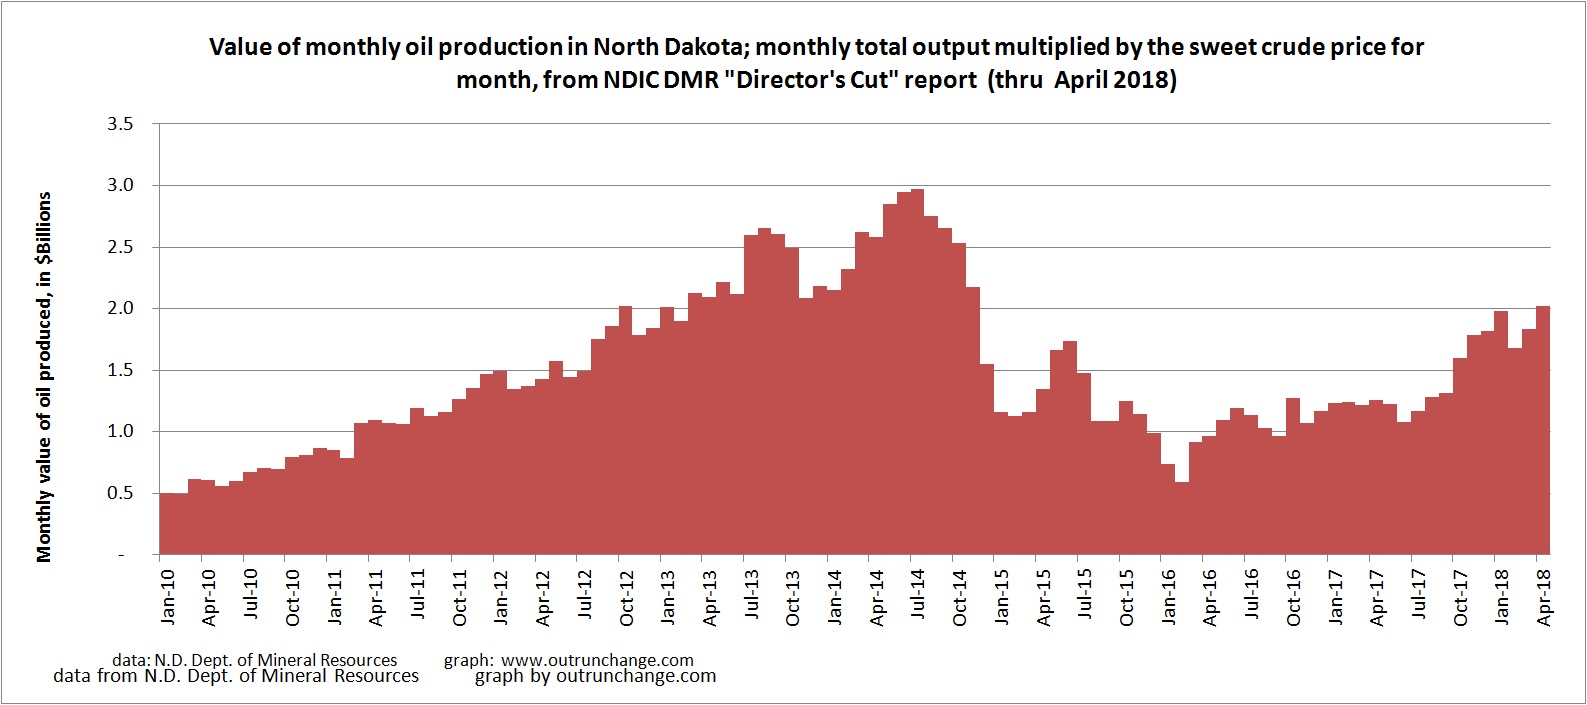
If you like having gasoline available at any gas station in your community at the moment you want to get a tank filled, that is a really cool graph.
Hi Jim:
Thought this novel about how economic theory actually does affect ecosystems might be of interest:
The Entropy Model: A Novel
https://www.amazon.com/ENTROPY-MODEL-Novel-Thomas-Tunstall/dp/1982920610/ref=tmm_pap_swatch_0?_encoding=UTF8&qid=&sr=
Tom
________________________________
Hi Tom:
Looks like a good read. I have a looooong wish list of books I want to read and I’ll add this to the list. Fiction books that explain economics are quite a fun concept.
Jim
P.S. And self-published too! For anyone interested in writing a book rattling around in your brain that you just gotta’ tell the world, please consider it is staggeringly easy to publish a book today. If you are reasonably comfortable with Word or Excel or running a blog, you can publish a book. It is that easy.