I’ve been watching the tally of daily rig count for a while. When I think about it, I jot down the count listed at The Million Dollar Way blog. Occasionally, as in every few months, I post my tallies.
By the way, if you have even the slightest interest in my comments on my blog you really, really, reallyneed to read MDW.
Decided to put all that data into a graph to help me see the trends from another direction. So, I combined all the data that has been accumulated haphazardly over time and put it in a graph.
If it helps you see some patterns, I’ll share my graph.
Keep a few things in mind:
The data is accumulated when I think of jotting it down, so this is not a complete database
Don’t read anything in to the gaps in data
Data hasn’t been double-checked, so there are likely inaccuracies
This shows general trends
The efficiency of drilling and total output from a well has improved radically in the last few years so data is not comparable over long terms
Having undercut my data and graph, here is a picture of the rig count in the state:
Robert Bryce explains in an editorial at the Wall Street Journal on 4/18/17 the lousy economics of rooftop solar panels: Thanks for Giving Me Your Tax Money.
Mr. Bryce appreciates each of us for giving him our money. Of course, it was done through the tax system so it wasn’t much of a gift. Anyone who did not go along with funding his lark would have to spend some time in jail.
He explains he installed a 8,540 watt solar system on his roof. That means the 28 panels generate 301 watts each.
I have been wanting to see financial results from an actual rooftop installation. Mr. Bryce provides a set of actual numbers.
Here is the breakdown of the actual cost:
$7,758 – federal tax subsidy
6,593 – subsidy from city owned utility
18,100 – his out-of-pocket costs
32,451 – total cost
That means you and I covered 44% of the cost.
He says his system is generating about 12 mWhMWh of electricity a year.
Hmm. That would be about 32.9 kWh a day. For a system with 8,540 watt capacity, the potential, or faceplate capacity is 205.0 kWh each day. So what’s the capacity production on his system?
It is astounding to ponder the news from the wide open frontier of space. I’m continually amazed by what is happening.
3/7/17 – Space News- NASA seeks information on commercial Mars payload service– NASA issued a Request For Information asking for plans to provide cargo runs to Mars. They are looking for outline of plans in terms of payload mass and weight, nature of vehicle, and timing for start of operations. The RFI indicates 2020 as a start date.
Two companies are described in the article as likely players in Mars cargo runs.
SpaceX would use their new lander Red Dragon as testbed for cargo vehicle. Launch was scheduled for 2018 but has slipped to 2020.
Mars One also has plans for a lander, as an intermediate step for crewed travel. First launch was planned from 2018 but that is now looking like 2022.
3/14 – Behind the Black – SpaceX wins another Air Force launch contract– Ticket price to launch a GPS satellite is $96.5M, up by $14M from the last launch by SpaceX for USAF. Post speculates SpaceX is trying to improve their margin by undercutting ULA less this time around.
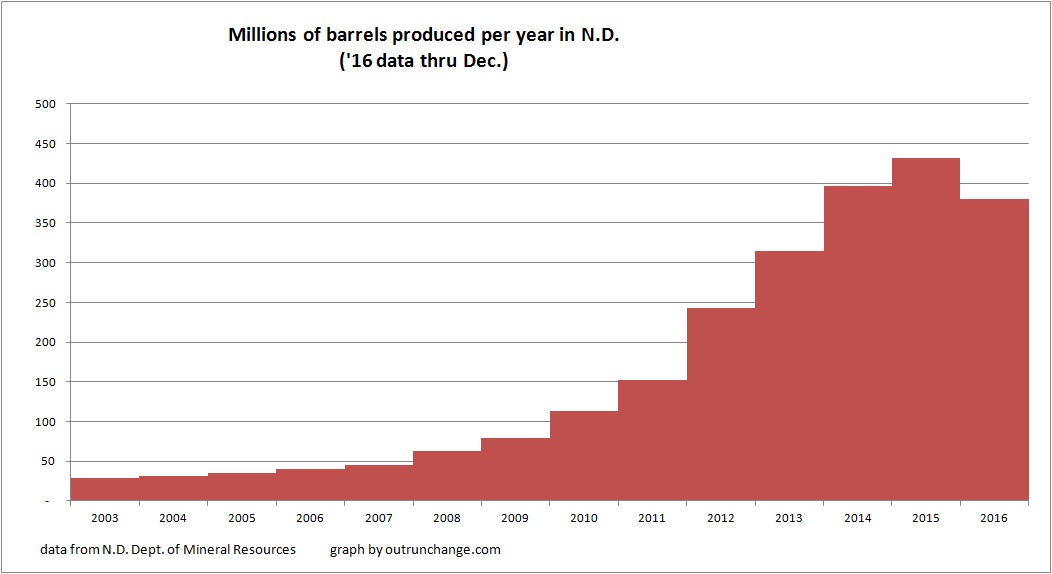
Let’s look at some longer term graphs of oil production in North Dakota and the value of that production. Here is a view of the annual oil production in the state:
The fascinating insight from that graph is production did not drop in 2015.
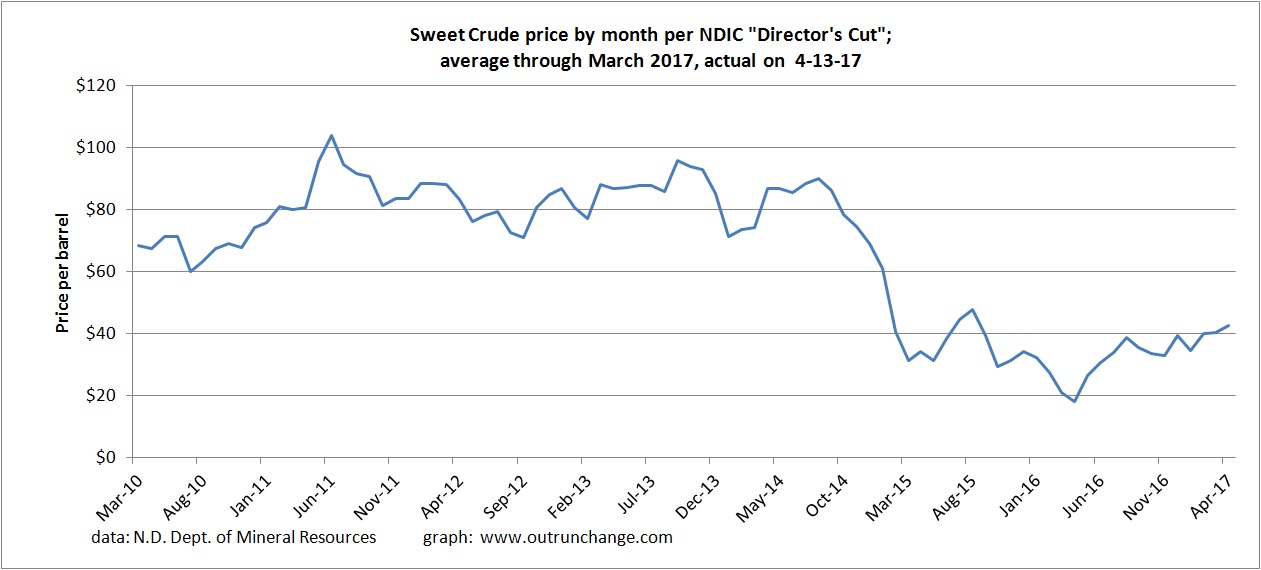
If you want to see one graph that explains the swings of drilling and oil production in North Dakota, take a look at this:
The price of oil for producers in the state collapsed in late 2014 due to the OPEC decision to increase production. The price recovered a bit in mid-2015 but continued to drop into the 20 something range.
The price has been steadily trending up, albeit slowly, since mid-2016.
That graph can then explain a lot of other trends.
For example, look at the count of average rigs in operation. The tally dropped dramatically in 2015. It has slowly been recovering since fall of 2016.
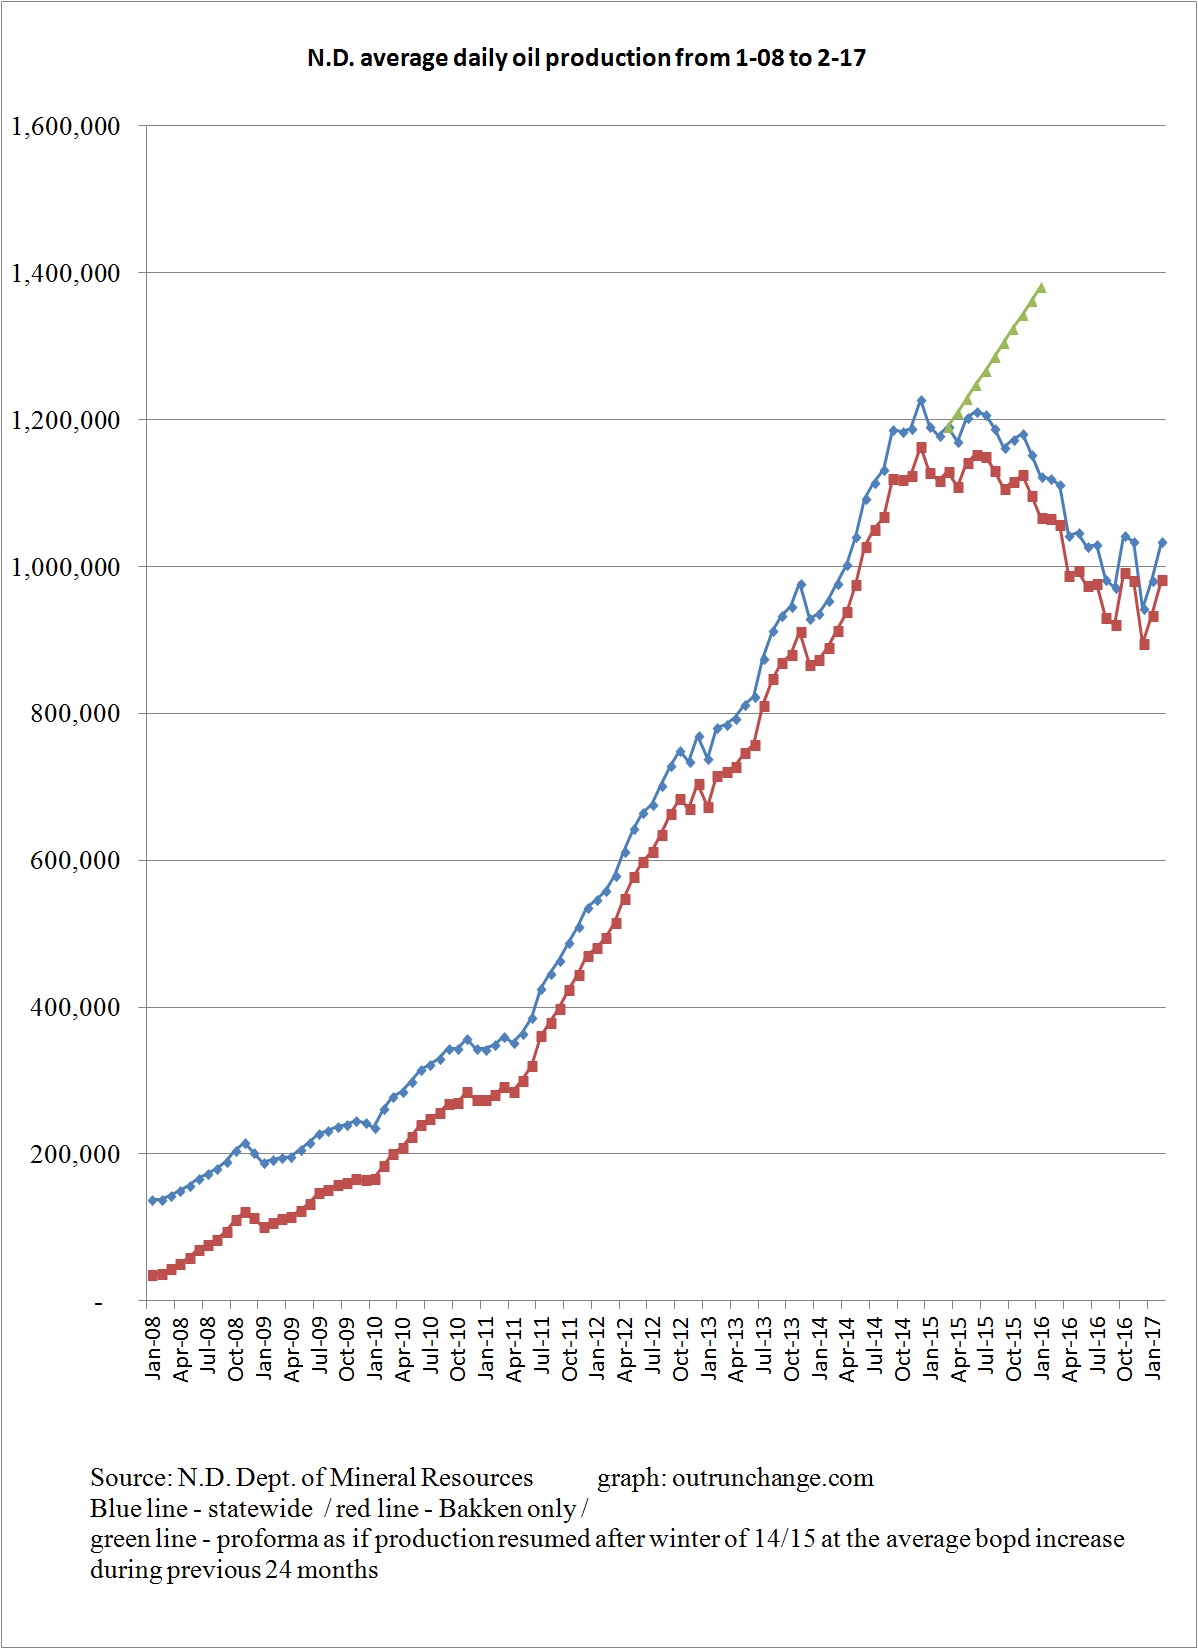
Oil production in North Dakota increased 5.38% in February to 1,034,168 bopd (preliminary). This follows a 4.14% increase in January. Two large changes in earlier months were an 8.91% drop in December 2016 and a 7.31% increase in October 2016.
I’ve not posted my usual graphs for a few months. Will get caught up in the next few days.
Here is a graph of average daily production, both state-wide and Bakken-only:
Here is a longer term view, with average daily production since 2004:
A prototype of solar panels installed in roads is being tested. Results are not particularly promising. (Similar story could be told of two projects in Europe, but will have to cover that another day.)
10/18/16 – Daily Caller News Foundation – Solar Road is “Total and Epic” Failure, 83% Of Its Panels Break in a Week – The test project is in Idaho. The concept is that 30 panels installed in a street (actually a walkway so the panels are not actually getting the wear of being in a road) will provide enough power to run a water fountain and the lights in a restroom.
Eighteen panels were DOA. Another five panels failed after a rain shower. Not a hail storm. Not an unseasonal torrential rain. Not a blizzard, as happens often in northern locations. Like Idaho.
A shower.
Article says only 5 of the 30 panels were working at the time.
The count of drilling rigs in operation across the state has shown strong increase since fall ’16.
Here is a recap of the North Dakota rig count, all from Million Dollar Way. It has been a while since I posted an update.
Keep in mind that the dramatic increase in productivity and production per well means that the number of rigs isn’t anywhere near as important as it was several years ago. At the same time, the count of rigs is still one indicator of activity. Perhaps the long-term trends aren’t important while the shorter term trends are.
Keep in mind I gather data when I think to make notes on the count. Also, I haven’t double checked the numbers, so there very well could be some errors.
The competition to be a commercially competitive space launch provider gets far more serious with SpaceX successfully launching a reused Falcon 9 booster to get SES-10 into a geosync orbit.
On the same day as SpaceX made such tremendous progress, two competitors dropped further behind.
Competition speeds up
I was so fortunate as to check my Twitter feed as SpaceX began its live coverage of the launch. It was such a joy to watch the successful launch and an even bigger thrill to see Main Engine Cutoff, which meant the reused booster did its job.
The Supreme Court of Venezuela ruled that it will take over all of the powers of the Congress. That essentially suspends the Congress and removes the remaining power center in the country that is not under the complete control of the president.
Since the president controls the supreme court and obviously now controls the legislature, there is no organized structure that can oppose him.
That’s a major step.
For more info, check out any of the following articles.
For entertainment, consider the spin some headline writers put into their work:
The shortages and suffering in Venezuela continues. Your homework for the day: what economic system provides this level of suffering?
Foreign reserves are shrinking
Bakeries threatened if they bake too many sweets and not enough price-controlled bread
Pregnant women are leaving the country to deliver their babies
Gasoline shortages appear
3/1/17 – CNN Money – Venezuela is down to its last $10 billion – The country’s foreign reserves are down to $10.5B, from $20B in 2015, and $30B in 2011. That info in sourced to the Central Bank of Venezuela.
Article says inflation is expected to hit 1660% this year and 2880% in 2018.
3/13 – PanamPost – Venezuelan Regime Threatens to Expropriate Bakeries, Jeopardizing Bread– In addition to price controls and currency controls, the government is going to impose output requirements on bakeries. If they don’t produce bread all day at the government limited price, they are subject to take over by the government. Left out of their miscalculation is that the government has stopped importing wheat flour.
If bakeries don’t bake enough bread, the government will close the shops.
2/19/17 – The Million Dollar Way – EURs – Bakken 2.0 – EUR means Estimated Ultimate Recovery, which is the total amount of oil expected to be extracted from one specific well. Article says the EURs in Bakken were 300K early on. At the point I started paying attention, the EURs were in the 500K range with possibilities of 1,000K.
Article says Mike Filloon has been talking about 1.5M instead of 1.0M.
Now the article lists 14 wells with EURs of 1.5M up to 2.0M EURs.
The routine surge of electricity during the late morning and early afternoon in California is disrupting the electricity system. Matching the excess production of electricity during the day with highest use in the evening is going to be expensive for consumers.
The underlying issue is solar is neither reliable nor dispatchable. The issue is beginning to be a problem and will get far worse.
3/5/17 – Wall Street Journal – How California Utilities are Managing Excess Solar Power – There is so much solar power in California that when the sun is bright, there is too much electricity and it must be sold cheaply just to get rid of it. Then, when the sun goes down and demand goes up after people get home from work, there isn’t enough electricity and the spot price goes sky high.
Article says that during the day, the wholesale spot price of electricity frequently shrinks to zero. Occasionally the wholesale spot price can hit $1,000 a megawatt-hour after dark. That would be about a dollar a kilowatt. $1.00.
At the end of the article there is a comment that on 178 days in 2016 the wholesale price went negative. The spot was below zero. The solar plants in California had to pay someone to take the excess electricity. I wonder what that does to the bottom line at Ivanpah? (That is a rhetorical question. – Impact on them is zero because I think they are on a multi-decade fixed price contract.)
Huge battery plants can store electricity during the day and discharge at night. That is expensive. Article says the price ranges from $285 up to $581 a megawatt-hour, which is in contrast to a natural gas peaker at $155 to $227 a megawatt-hour. That is around twice as expensive.
3/18/17 – David Danelski of Press-Enterprise at Daily Bulletin – Here’s how California ended up with too much solar power – The amount of solar power now online in California is so high that it is disrupting the electricity market.
The impact of so much solar capacity shows up at two times during the day.