Gross World Product, according to Wikipedia is
the combined gross national product of all the countries in the world. Because imports and exports balance exactly when considering the whole world, this also equals the total global gross domestic product (GDP).
I got curious about the world-wide GDP after thinking about two previous posts:
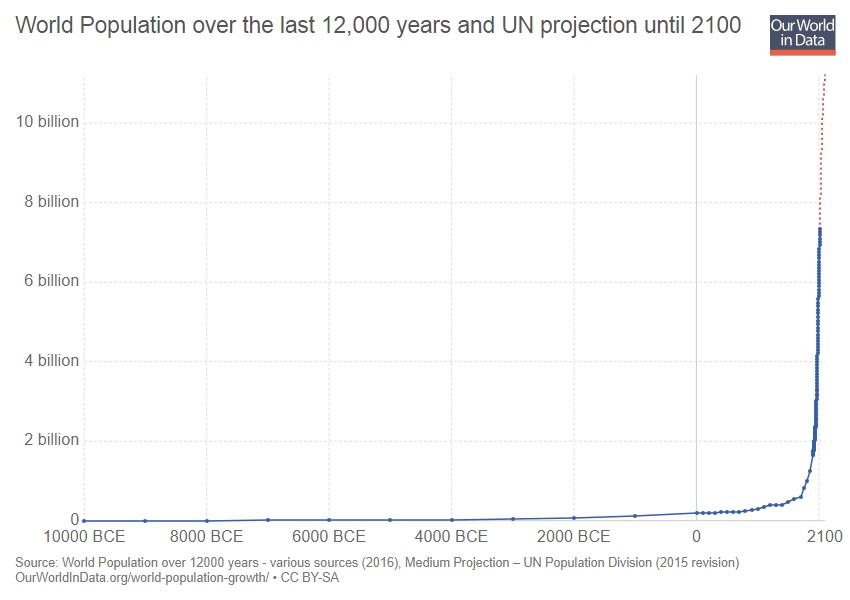
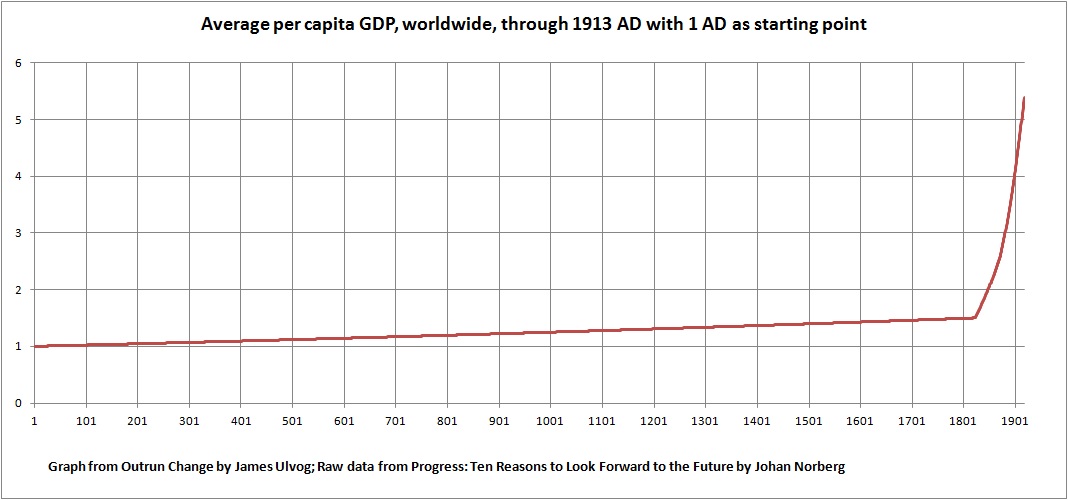
What would happen if you multiplied the drastic increase in population with the radical increase in per capita income? I made a feeble effort to multiple the two data sets and quickly realized that wouldn’t work. Poked around a bit on the ol’ internet thingie and found the answer at Wikipedia – gross world product is what I was looking for.
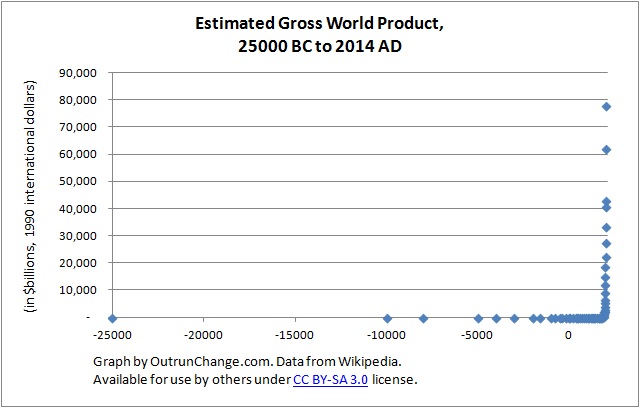
27,000 year time horizon – Check out the graph at top of this post for the estimated gross world product on a very long time horizon, specifically from estimates back in 25,000 B.C. through 2014 A.D.
Copyright notice: Graphs in this post are based on data in an article titled “Gross world product” by Wikipedia, which is licensed under CC BY-SA 3.0. As a result the following tables which are derived from this information are licensed for use by anyone under the same CC BY-SA 3.0 license. Any use of these graphs must in turn be distributed under the same license.
I will show the raw data at the end of this post.
With that 27,000 year time horizon, there is a radical turn in the 1900s, at which point the graph appears to goes from horizontal to straight up vertical.
That is too long of a time horizon to understand, so I broke it out into smaller blocks.
Last 2,000 years – To remove the many earlier millenniums of slow growth, time horizon was revised to 1 AD through now. Notice there is still a radical change in the 1900s. With the dramatic changes in the last 200 years, the line from earlier looks like it is flat, but it isn’t.
Continue reading “Gross World Product over last 27,000 years”
