The visual appearance of a million barrel a day oil field

OLYMPUS DIGITAL CAMERA

(All photos by James Ulvog. Above view of 4 pads, with a pair of flares visible in the middle and workover rig on pad in lower left.)

Following post was written on October 18, when my wife and I flew out of Williston:

We took a 6:25 a.m. flight, so it was still dark. The view on departure was fabulous.

I wish I had the camera equipment (and the skill) to show what I saw.

Words will have to suffice, along with photos taken during daylight.

Sky was clear until several minutes from the airport, then clouds slowly built up.

Drilling rigs are quite visible, what with those tall metal superstructures and the working deck all lit up. Sorta’ like an all white Christmas tree.

Continue reading “The visual appearance of a million barrel a day oil field”

“I, Egg”, or, how many millions of people have to cooperate for you to boil one egg?

Check out Exxon-Mobil’s commercial. Try to take a completely wild guess how many people are involved in getting one egg to your house and the number of people and millions of dollars of investment needed to get a bit of natural gas to the stove:

[youtube=http://www.youtube.com/watch?feature=player_embedded&v=PmD8B64vSM8]


Continue reading ““I, Egg”, or, how many millions of people have to cooperate for you to boil one egg?”

In addition to gracious help from Indians, what moved the Pilgrims from starving to thriving?

The first winter for the Pilgrims was terrible. Between starvation, pneumonia, and tuberculosis, about half died.

The second winter was terrible, again with little food. Those who survived the first two winters only did so by the goodness of the Native Americans who graciously shared their food.

The third winter was far better, with plenty of food. In a few years, there was enough abundance that the Pilgrims had paid off their debt to those who financed their trip. They were alive, thriving, and free of debt.

Those are a few highlights of the Pilgrims’ story told by Karl Denninger in his article from 2006, which is reposted at Market-Ticker:  The Truth About Thanksgiving.

What caused the change from starving to thriving is the part of the story I never heard growing up.

Continue reading “In addition to gracious help from Indians, what moved the Pilgrims from starving to thriving?”

Would you rather be in the middle class today or the richest man in the world in 1836?

If it was possible to choose, would you prefer to live life in the middle class, struggling to get by in a lousy economy with an uncertain retirement, or would you rather live the life of Nathan Rothschild, who was the richest man on the planet when he departed this life in 1836?

John Kay discusses this idea in his article, Precise inflation figures ignore evolutions in product quality and consumer choice.

Mr. Kay points out that Mr. Rothschild was richer than either John D Rockefeller or Bill Gates. He was the second richest man in all of history.

Before you say you’d rather live his life than yours, consider this:

Continue reading “Would you rather be in the middle class today or the richest man in the world in 1836?”

Staffing problems in the Bakken

OLYMPUS DIGITAL CAMERA

(Photo by James Ulvog)

While in Williston earlier this month, I saw the above sign in front of Wal-Mart saying they are paying $17 an hour to start. I hear starting pay for night stockers is $19 an hour.

My guess from what I heard while in town is $17 at Wal-Mart is the starting, minimum wage for new arrivals in town. With their staffing need, that might also be the first job upon arriving in town for lots of people.

The Williston Herald had a great article on employment issues in North Dakota: “Labor shortage forcing some restaurants to close”. The article was in the 10/17/14 paper but I couldn’t find it online.

Continue reading “Staffing problems in the Bakken”

Paperback books and e-books; more on the dispute between Hachette and Amazon

Guess what? Lowering the price on something means you can sell more of it and make more money.

That applies to paperbacks when they first came out and it applies to e-books today. Well, it actually applies to practically everything.

Know what else? Anyone who wants to publish a book can do so. Anyone. For astoundingly low cost. The publishing frontier is wide open. Thank you Amazon.

In August, Amazon sent an e-mail to people using their Kindle Direct Publishing service. (By the way, if you aren’t already a best seller and want to ever get your book published, you really, really ought to go the e-book route with KDP. It is awesome.)

Back to the e-mail.

Since it went out to tens or hundreds of thousands of people, I will take the liberty to quote it.

Some history: Continue reading “Paperback books and e-books; more on the dispute between Hachette and Amazon”

Puritans started with socialism and price controls before they jumped to capitalism

There is a concept loose in the U.S. and emphasized in our educational system that the Puritans arrived in the U.S. believing in capitalism and went straight to economic prosperity.

Well, capitalism will definitely do that, but the Puritans made a few stops before getting to prosperity. Those included socialism, price controls, and severe caps on finance & trade under the guise of opposing usury. All of those policies will suppress economic development.

Jerry Bowyer explores this journey through false ideas is a series of articles, which summarize his interview with Mark Valeri, author of Heavenly Merchandize.

To encourage you to check out the full articles, I’ll try to summarize some key ideas.

7/30 – Forbes – Jerry Bowyer – Puritans vs. Capitalism: How A Theological Error Led To Financial Stagnation – In the 17th century, pastors and religious leaders were opposed to usury which included even discounting letters of credit more than a small amount. If you can’t use paper (bills of credit) to facilitate long-distance trading, there won’t be much trading.

Continue reading “Puritans started with socialism and price controls before they jumped to capitalism”

If you want to increase the number of large animals like elephants and rhinos, allow them to be privately owned and hunted

Kenya and South Africa have taken dramatically different approaches in how to protect large animals.

May not make sense, but I have a plan for you if you want to protect big critters, like rhinos, lions, leopards, elephants, and buffalos (the big 5) along with antelopes and zebras.

What to do? Take South Africa’s approach and allow private ownership of the animals and allow other people to pay the owners of the animals to hunt them.

Like I said, it doesn’t make sense, but incentives matter. And if you want to protect big animals, give individuals incentives to do so.

Kenya and South Africa provide a natural experiment to see which approach works best.

The following information is from two articles:

Kenya

Kenya bans private ownership of large animals and bans hunting. The country focuses on conservation with funding provided by eco-tourism.

How has that worked?

Continue reading “If you want to increase the number of large animals like elephants and rhinos, allow them to be privately owned and hunted”

Illustration of creative destruction: lots of Fortune 500 companies disappeared over the last 60 years

What sets apart each of these groups of companies?

Group A: American Motors, Brown Shoe, Studebaker, Collins Radio, Detroit Steel, Zenith Electronics, and National Sugar Refining.

Group B: Boeing, Campbell Soup, General Motors, Kellogg, Proctor and Gamble, Deere, IBM and Whirlpool.

Group C: Facebook, eBay, Home Depot, Microsoft, Office Depot and Target.

Mark Perry, writing at Carpe Diem, explains: Fortune 500 firms in 1955 vs. 2014; 89% are gone, and we’re all better off because of that dynamic ‘creative destruction’.

Continue reading “Illustration of creative destruction: lots of Fortune 500 companies disappeared over the last 60 years”

Astounding progress everywhere in everything over last 50 years – No better time to be alive than today.

As a break from the dreary news headlines, consider the progress made over the last 50 years in a variety of areas.

Matt Ridley offers a lot of Reasons to be cheerful.

Here is an overview:

Compared with any time in the past half century, the world as a whole is today wealthier, healthier, happier, cleverer, cleaner, kinder, freer, safer, more peaceful and more equal.

Continue reading “Astounding progress everywhere in everything over last 50 years – No better time to be alive than today.”

Washington state regulation of pot sales – edibles rules, taxes on taxes, and how do you deliver product?

I am watching the legalized markets for marijuana in the states of Washington and Colorado. I think this is a natural experiment in regulation. How well does a new industry develop when it is under heavy regulation?

Some additional info:

7/21 – KCET – The New Frontier of Marijuana Edibles Regulation – The author seems to know his way around a California-based medical marijuana dispensary, noting they are looking more like a corner grocery store these days, what with all the edible products on the shelf.

He describes some of the edibles issues in Colorado and Washington.

Continue reading “Washington state regulation of pot sales – edibles rules, taxes on taxes, and how do you deliver product?”

What Peak Natural Gas? – #1

While researching for my post, Encore question: What Peak Oil – #36, I browsed a bit more of Dr. M. King Hubbert’s 1956 paper, Nuclear Energy and the Fossil Fuels, which you can find here.

In addition to a precise calculation of the total crude oil that will be extracted through 2050 from Texas, the U.S. in total, and from the entire planet, he also made some calculations for natural gas.

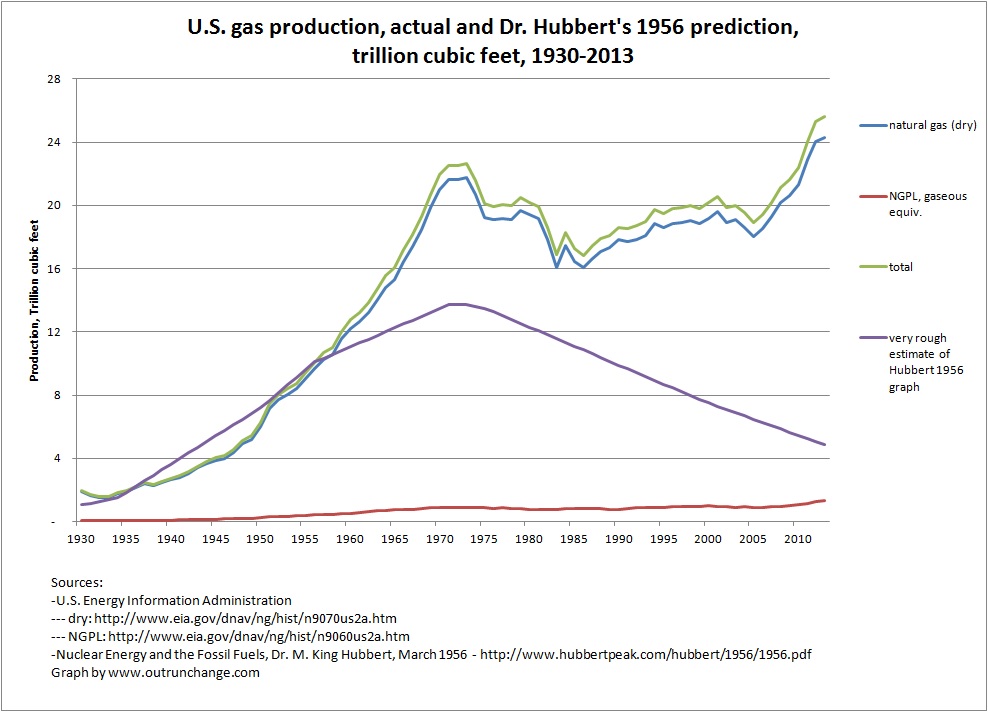
In Figure 22 on page 32, he calculated the production curve of natural gas in the U.S. through 2075, at which point production is indistinguishable from zero. The calculations are to three significant digits.

The graph is based on the same logic and analysis as Peak Oil. Namely that the total amount of a resource that will ever be extracted can be calculated and the production curve graphed with reasonable accuracy. There will be a peak followed by a slow, inevitable, unavoidable decline to near zero. When the production turns a corner at what appears to be the peak, 50% of the total that will ever be extracted has been pulled, which means roughly the same amount will be extracted in the future.

That concept applied to natural gas is a complete failure for the same reasons as Peak Oil is a failure.

The conceptual reasons are discussed in the series of posts addressing What Peak Oil?

A graph showing the failure of Peak Natural Gas is more dramatic that the graph of Peak Oil.

Graph of actual production and Dr. Hubbert’s prediction.

I pulled the natural gas (dry) and NGPL data from EIA for 1930 through 2011.

I don’t have the raw data for the curve Dr. Hubbert drew and don’t have the software to calculate the curve. 

So I pulled approximations from the graph in Figure 22. Made estimates for 1925, 1934, 1950, 1956, 1971, 1972, 1973, 1975, 2000, and 2025. Then I interpolated the years between those data points.

The resulting graph I drew is visually comparable to Dr. Hubbert’s graph in Figure 22. Specifically, the 1956 data matches, the peak is around 14T in the mid-‘70s, and the 2000 data point is below 8T.

If you have more accurate data, let me know and I’ll redraw the graph. As a rough comparison, I’ll bring in another graph in a moment.

So, here is the comparison of actual production to my rough redrawing of Dr. Hubbert’s prediction:
gas prod actual and hubbert

Please, please don’t take my word for it. Please check Figure 22 for yourself.

Can you say busted?

Continue reading “What Peak Natural Gas? – #1”

“Hockey Stick of Human Prosperity”

Take any one of a variety of economic indicators. Per capita income. Life expectancy. Stuff people own. Average height. Child mortality. Number of pants and underwear owned.

Graph it over the last 2,000 years.

You will see a hockey stick. Flat with no growth for century after century. Brutal, hungry, and disease-ridden short lives were the norm 3000 years ago.

And 1000 years ago.

And 500 years ago.

So far, any graph you draw of any of those indicators is a flatline.

Then, about 200 years ago, every one of the graphs took off like a Shuttle launch. Something happened.

For the first in a series of videos, Professor Don Boudreaux explains what this hockey stick looks like.

And what made things get so mind-bogglingly better.


[youtube=http://www.youtube.com/watch?v=t9FSnvtcEbg&feature=player_embedded]


Another idea for a hockey stick graph: number of natural teeth in your mouth at age 50.

Oh, wait. People usually didn’t live that long until a few hundred years ago.

link is http://www.youtube.com/watch?v=t9FSnvtcEbg&feature=player_embedded

Appeals court says devastation from New Deal is still okay; We lost a hero who also suffered at the hands of the New Deal

Did you know the enlightened wizards of the New Deal worked out a plan that raisin producers had to turn over a percentage of their crop to the government and not get paid for the raisins?

Yes, that was actually a plan developed back in the ‘30s.

Did you know that plan is still in place? Eighty years later?

I discussed that a year ago – Economic destruction from the New Deal just keeps rolling on.

The lawsuit I mentioned back then involved farmers who were told to give 47% of their ’02 crop and 30% of their ’03 crop to the government without compensation.  The case went to the Supreme Court, which ruled the farmers did actually have standing to sue the government. The case went to the 9th Circuit Court for consideration of their claims.

Guess what?

Continue reading “Appeals court says devastation from New Deal is still okay; We lost a hero who also suffered at the hands of the New Deal”

I’m not the only one who thinks there is danger of major inflation – chairman of the Philadelphia Fed thinks so too

There is a huge amount of excess reserves just sitting in bank vaults (actually on deposit at the Fed). By huge, I’m talking around $2.5 trillion. That amount is from Charles Plosser, chairman of the Philadelphia Federal Reserve Bank.

Marketwatch reports on 5/20: Chalres Plosser thinks there’s a ticking time bomb at the Fed.

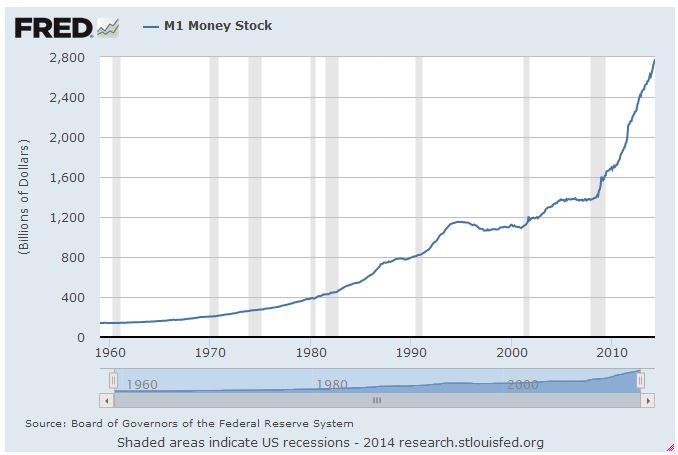
Look at it a different way. Here is the M1 money stock, which I pulled from the Fed’s database:

money supply 5-14

See that huge increase in M1 from the start of the latest recession? Continue reading “I’m not the only one who thinks there is danger of major inflation – chairman of the Philadelphia Fed thinks so too”