More entries on the list of economic sectors devastated by the shutdown.

Image courtesy of Adobe Stock.

Hat tip to Behind the Black for the legwork identifying additional sectors of the economy that are collapsing. Large segments of the economy I haven’t mentioned before:

  • Home sales
  • Housing construction
  • Apartment rentals
  • Clothing production
  • Flower trade

Damage to these sectors won’t immediately heal the moment state governors decide they will allow the economy to come back to life out of its induced coma.

Home sales

4/21/20 – Fox Business – US home sales plunge 8.5% in March, and it may grow worse – Sales of existing homes dropped 8.5% in March. Article use the word “cratered.”

Continue reading “More entries on the list of economic sectors devastated by the shutdown.”

Magic of the price signal to change production levels.

Fourteen wells on one pad, located on the southeast side of Williston, N.D. Photo by James Ulvog.

The double black swan of COVID-19 pandemic from the demand side and Saudi Arabia flooding the market from the supply side is creating a sales problem and storage problem for the oil industry.

Regulators in Texas are thinking about about ordering a pro-rate reduction in production. In other words, they are considering giving each producer an order on how much to cut.

North Dakota has no such plans.

North Dakota is planning to rely on capitalism to rapidly adjust production.

Continue reading “Magic of the price signal to change production levels.”

Economic damage from shutdown – 4/15.

Image courtesy of Adobe Stock.

A few more articles on damage we are seeing from the economic shutdown.

(Cross post from my other blog, Attestation Update.)

Guess on California unemployment rate

April 2020 – Eberhardt School of Business, University of Pacific – Initial Estimates of Employment Impacts of Covid-19 Pandemic – The school of business estimates an unemployment rate of 18.8% in California for the month of May 2020.

This is in contrast to 2010 rate of 12.2% and 2019 rate of 4.0%.

Likely increase in bankruptcies

4/13/20 – Washington Examiner – Pandemic likely to exceed Great Recession in number of bankruptcies – Economists from a leftist think tank and a conservative think tank both guess that the  number of bankruptcies from the current shutdown of the economy will exceed the number from the Great Recession.

Continue reading “Economic damage from shutdown – 4/15.”

Economic news: Surge in new unemployment claims; unemployment rate starting to rise.

Image courtesy of Adobe Stock.

Another huge jump in new unemployment claims. The rise in count of people without work is barely starting to show in the unemployment rate.

It would be wise to start watching the economic stats more closely than usual.

(Cross-post from my other blog, Attestation Update.)

4/9/20 – CNBC – US weekly jobless claims jump by 6.6 million and we’ve now lost 10% of workforce in three weeks – Another surge in new unemployment claims announced today. Here is a recap:

Continue reading “Economic news: Surge in new unemployment claims; unemployment rate starting to rise.”

Capitalism or fascism? Which economic system will better resolve the supply shortages?

Image courtesy of Adobe Stock.

How do we get enough of the respirators, personal protective equipment, and medicine we need to get through the COVID-19 pandemic?

Fascinating to watch the press conference Saturday 3/21/20 with various federal officials and members of the coronavirus task force.  Most fascinating feature was looking at the various comments and questions/answers from an economics perspective. Thought about Friday’s briefing as well.

Here is the difference in perspective I perceived: do we rely on capitalism or fascism as our model to get things done?

Underlying the comments from all the federal officials is the idea that the private sector can figure out how to provide everything we need.

The common thread underlying a huge portion of the questions from media is the idea that the federal government should tell which specific companies how much of which specific products to produce, specify they price they will charge, and provide the addresses for where to send each pallet of supplies.

In other words, should we use a capitalist model to provide goods we need or should we use the fascist model?

As a thumbnail description, in the fascist economic model the means of production are owned by the private sector but the central planning authority tells companies how much of which product to produce. In contrast, the next step away from freedom is communism, in which the means of production are owned by the government and a central planning agency decides how much of each specific product to produce.

Capitalism?

Continue reading “Capitalism or fascism? Which economic system will better resolve the supply shortages?”

Didn’t ever expect I’d personally experience Soviet Union and Venezuelan style grocery stores.

Chaika 3 (on redscale film) – Queue by Jaroslav A. Polak is in the public domain (CC0 1.0). Lines like this outside a grocery store were normative in the Soviet Union (except for the cell phone, obviously).

In the Soviet Union and Venezuela, grocery shopping involved/involves listening for rumors of which store got a shipment overnight, standing in line for hours, looking at lots of empty shelves, and going to the store daily to see if what you need might actually be on the shelf today.

If you have been awake the last seven days, you know that is what grocery shopping looks like in the U.S. today.

The difference between the Evil Empire and the worker’s paradise of Venezuela on one hand and the United States on the other hand is that the supply chain in the U.S. is still stocking the shelves and in a week or two or three will have them filled up.

Continue reading “Didn’t ever expect I’d personally experience Soviet Union and Venezuelan style grocery stores.”

The 2010’s: best decade in history.

Image courtesy of Adobe Stock.

Matt Ridley explains the best improvement in living standards for us humans over a single decade is the decade that ends today, 12/31/19.

(Cross-post from my other blog, Freedom is Moral.)

He explained his point from multiple directions on 12/21/19 in Spectator: We’ve just had the best decade in human history. Seriously.

A few of his points that caught my interest:

The rate of extreme poverty in the world has dropped from 60% when he was born to under 10% in this decade. If you ache to seek less people in dirt eating poverty that is a wonderful thing.

Continue reading “The 2010’s: best decade in history.”

Cost and time to cross the Atlantic has dropped by more than 90% in the last 500 years.

Columbus’ Ships. Image courtesy of Adobe Stock.

Transatlantic travel time has dropped radically in the last 500 years.  Time to transit the Atlantic has dropped about 99% and cost has dropped about 95% by my calculations.

Let’s look at several data points for cost and time, then calculate one indicator of improved quality of life.

Human Progress provides fun data points on August 2, 2018 in their post, A Reminder of How Far Transatlantic Travel Has Come.

Update: An earlier post on November 27, 2015 discussed Time to cross the Atlantic – 500 year history.

Update: Added in travel time of Concorde at end of the post.

Columbus’ first trip

The 1492 trip by Christopher Columbus took two years of lobbying before the king and queen of Spain approved 2 million Spanish maravedis to fund the trip. A professor has calculated that would be comparable to about US$1,000,000 today.

The cost seems low to me. I’ll look at that more later.

Crew size was 87 according to this article. The accountant in me is driven to calculate the cost per crewman.  That would give an average cost of $11,494. I’ll round that to $11,500 and ignore any adjustment for several crew members who died on the trip.

His trip took two months, nine days, which I calculate at 70 days (30+31+9).

Mayflower

Mayflower. Image courtesy of Adobe Stock.

Continue reading “Cost and time to cross the Atlantic has dropped by more than 90% in the last 500 years.”

Abundance of food today compared with routine scarcity of food earlier than 150 years ago.

Abundance of refrigerated fresh meet at your conveniently available grocery store. Not an option for anyone on the planet 200 years ago, to say nothing of the 10,000 years prior. Photo courtesy of Adobe Stock.

Johan Norberg describes the tremendous progress in the last several hundred years in so many areas, such as life expectancy, health, sanitation, liberty, education, and equality in his book Progress: 10 Reasons to Look Forward to the Future. Here are a few more tidbits I found fascinating.

Consider the scarcity of food in the past and the drop in cost to feed a family in the last 150 years.

Food

Look at just a few of the statistics on availability of food:

Continue reading “Abundance of food today compared with routine scarcity of food earlier than 150 years ago.”

Gross World Product over last 27,000 years

Gross World Product, according to Wikipedia is

the combined gross national product of all the countries in the world. Because imports and exports balance exactly when considering the whole world, this also equals the total global gross domestic product (GDP).

I got curious about the world-wide GDP after thinking about two previous posts:

What would happen if you multiplied the drastic increase in  population with the radical increase in per capita income? I made a feeble effort to multiple the two data sets and quickly realized that wouldn’t work. Poked around a bit on the ol’ internet thingie and found the answer at Wikipedia – gross world product is what I was looking for.

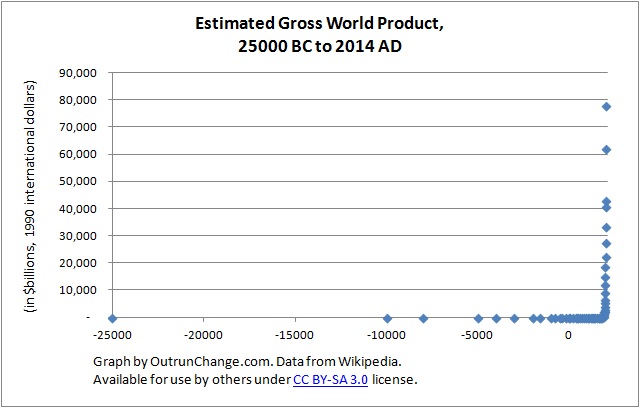
27,000 year time horizon – Check out the graph at top of this post for the estimated gross world product on a very long time horizon, specifically from estimates back in 25,000 B.C. through 2014 A.D.

Copyright notice:  Graphs in this post are based on data in an article titled “Gross world product” by Wikipedia, which is licensed under CC BY-SA 3.0.  As a result the following tables which are derived from this information are licensed for use by anyone under the same CC BY-SA 3.0 license. Any use of these graphs must in turn be distributed under the same license.

I will show the raw data at the end of this post.

With that 27,000 year time horizon, there is a radical turn in the 1900s, at which point the graph appears to goes from horizontal to straight up vertical.

That is too long of a time horizon to understand, so I broke it out into smaller blocks.

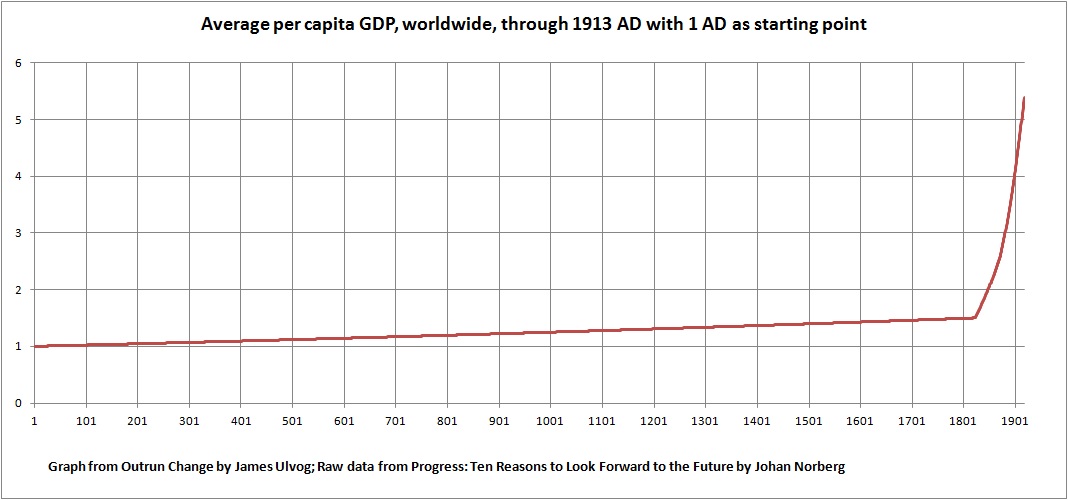
Last 2,000 years – To remove the many earlier millenniums of slow growth, time horizon was revised to 1 AD through now. Notice there is still a radical change in the 1900s. With the dramatic changes in the last 200 years, the line from earlier looks like it is flat, but it isn’t.

Continue reading “Gross World Product over last 27,000 years”

Increase of income per person over last 200 years

Here is an approximation of annual per capita GDP from 1 AD through 1913:

I’ve long been amazed at the radical growth in per capita wealth over the last 200 years. That means since the Industrial Revolution.

Living in dirt-eating poverty as the normal way of life for essentially every person on the planet changed about 200 years ago, give or take.

Continue reading “Increase of income per person over last 200 years”

More economic and environmental fails from wind energy

Still about 4 or 5 miles away from the turbines. Many of the towers are visible from highway 2. Photo of wind turbines north of Tioga, N.D. by James Ulvog

The bad news from slicer-and-dicers just keeps rolling in.

  • Article describes lack of CO2 benefit while running up cost of electricity in Minnesota
  • Description of environmental cost of building a wind tower

10/15/17 – Powerline – “Green” Energy Fails Every Test – Minnesota is touted as a model of green energy. With around $15 billion poured into wind power, the state is a good example of the damage from green.

More wind is produced in spring and fall, which does not correlate to when more electricity is needed, which is summer and winter.

So how has that $15,000,000,000 dumped into bird chopping turbines turned out?

CO2 emissions from the state, according to a new study, have only declined slightly. The drop during 2 years was due to an accident that took a coal plant off-line. Other than that, the drop is CO2 has been minor; nothing like what was supposed to happen with all that wind power.

Main reason is wind is very unreliable. When those slice-and-dicers aren’t producing, the energy comes from backup coal plants. So when there is little wind and high demand in the summer and winter, where does the extra electricity come from?

Continue reading “More economic and environmental fails from wind energy”

Venezuela continues to collapse

Oil platform in Venezuela. A view of what used to be and could have been now. Image courtesy of Adobe Stock.

The bad news from Venezuela just doesn’t stop:

  • Protests have stopped because of lost hope
  • Professionals become prostitutes just to get enough food to keep the family life
  • Elections for state governors finally to be held on Sunday
  • Former executive of Brazilian construction company admits to paying $35 million to Venezuelan president’s election campaign
  • Guess on inflation rate for 2018 is over 2,300%

8/31/17 – Wall Street Journal – “Hope Is Gone” as Venezuelan Protesters Vanish From Streets – The protests have faded away. The ongoing massive arrests, torture of detainees, widespread human-rights abuses, and frequent shootings seem to have broken the protest movement. A number of senior leaders of the opposition have fled the country in fear for their life. Reports indicate 125 people have been killed and somewhere around 2000 have been wounded, with many of those people with permanent injuries.

One outside observer, who is safe because he is an American living in the United States, observers the president has gained effective control of the entire government. I think if we look at the typical definitions that makes him a dictator.

In the meantime the oppressed people of the country continue to scramble for food, trying to find enough so they don’t starve to death.

9/22/17 – Miami Herald – In Venezuela, they were teachers and doctors. To buy food, they became prostitutes. – A large portion of the prostitutes in Columbia are women who escaped Venezuela. Before transitioning to the world’s oldest profession, many of them were teachers, doctors, professional women. One brothel even has a petroleum engineer.

Continue reading “Venezuela continues to collapse”

Radical drop in cost of lighting as indicator of how much better our lives are today

From really expensive candles to cheap electricity for brighter light bulbs. What luxury we now have!  “Trip the Lights Fantastic” by Anne Worner is licensed under CC BY-SA 2.0

One measure of how radically life has improved over the centuries is how much nighttime illumination can be purchased from a certain amount of labor.

For example, George Washington calculated that it cost him £5 a year to provide himself five hours of reading light every evening. That is the equivalent of about $1,000 today.

Imagine spending $83 a month to light only one lamp in your entire house.

We are amazingly rich today.

This insight provided by Human Progress on 2/15/17:  How the cost of light has fallen by a factor of 500,000.

Here are some reference points provided by the article:

Continue reading “Radical drop in cost of lighting as indicator of how much better our lives are today”

Rapid economic growth of the American colonies before the revolution.

3D Growth Projections” by ccPixs.com is licensed under CC BY 2.0www.ccPixs.com

Take a look at how rapidly the colonies developed over the many years in advance of the successful American revolution. Comments are from An Empire of Wealth: The Epic History of American Economic Power by John Steel Gordon.

One part that is astounding to me is certain geographies were very conducive to a certain type of crop. That is why tobacco, or corn, or cotton, or fishing for cod thrived in certain areas.

Consider: export of tobacco from Virginia to England:

  • 1618 – 20,000#
  • 1622 – 60,000#
  • 1627 – 500,000 #
  • 1629 – 1,500,000#
  • 1638 – 3,000,000#

let’s look at the annual increase and compound rate of growth:

Continue reading “Rapid economic growth of the American colonies before the revolution.”