What Peak Natural Gas? – #1

While researching for my post, Encore question: What Peak Oil – #36, I browsed a bit more of Dr. M. King Hubbert’s 1956 paper, Nuclear Energy and the Fossil Fuels, which you can find here.

In addition to a precise calculation of the total crude oil that will be extracted through 2050 from Texas, the U.S. in total, and from the entire planet, he also made some calculations for natural gas.

In Figure 22 on page 32, he calculated the production curve of natural gas in the U.S. through 2075, at which point production is indistinguishable from zero. The calculations are to three significant digits.

The graph is based on the same logic and analysis as Peak Oil. Namely that the total amount of a resource that will ever be extracted can be calculated and the production curve graphed with reasonable accuracy. There will be a peak followed by a slow, inevitable, unavoidable decline to near zero. When the production turns a corner at what appears to be the peak, 50% of the total that will ever be extracted has been pulled, which means roughly the same amount will be extracted in the future.

That concept applied to natural gas is a complete failure for the same reasons as Peak Oil is a failure.

The conceptual reasons are discussed in the series of posts addressing What Peak Oil?

A graph showing the failure of Peak Natural Gas is more dramatic that the graph of Peak Oil.

Graph of actual production and Dr. Hubbert’s prediction.

I pulled the natural gas (dry) and NGPL data from EIA for 1930 through 2011.

I don’t have the raw data for the curve Dr. Hubbert drew and don’t have the software to calculate the curve. 

So I pulled approximations from the graph in Figure 22. Made estimates for 1925, 1934, 1950, 1956, 1971, 1972, 1973, 1975, 2000, and 2025. Then I interpolated the years between those data points.

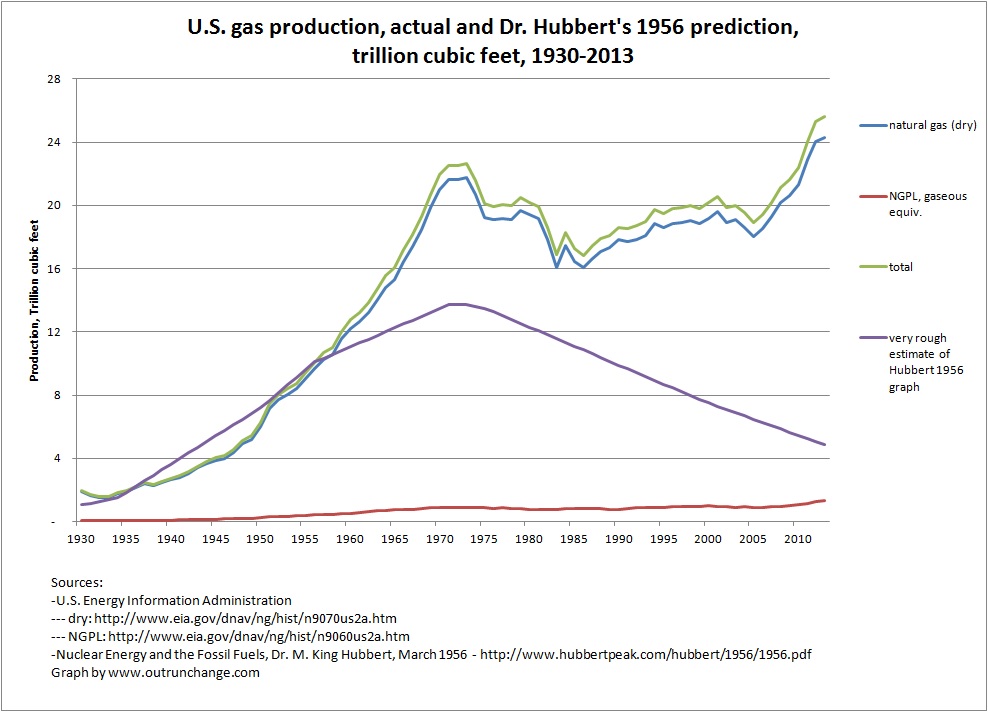
The resulting graph I drew is visually comparable to Dr. Hubbert’s graph in Figure 22. Specifically, the 1956 data matches, the peak is around 14T in the mid-‘70s, and the 2000 data point is below 8T.

If you have more accurate data, let me know and I’ll redraw the graph. As a rough comparison, I’ll bring in another graph in a moment.

So, here is the comparison of actual production to my rough redrawing of Dr. Hubbert’s prediction:

gas prod actual and hubbert

Please, please don’t take my word for it. Please check Figure 22 for yourself.

Can you say busted?
Continue reading “What Peak Natural Gas? – #1”

Encore question: What Peak Oil? – #36

Some commenters on the ‘net did not agree with my previous post which combined the U.S. production of crude oil with natural gas (dry) and NGPL.

Fair point.

I redrew the graph showing crude oil only.

Will draw Dr. Hubbert’s peak natural gas curve and actual production another time.

Update: The time is the next day. See the graph of actual versus predicted for natural gas:  What Peak Natural Gas? #1. Can you say busted?

Peak Oil

Peak Oil theory is outlined by Dr. M. King Hubbert, starting in his 1949 article, discussed here.

For anyone tuning into the discussion, here is the theory in very brief, key terms: Peak oil production will be reached at a determinable date, after which production will enter an inevitable, permanent decline. The rate of decline is calculable. The graph of production is calculable. Dr. Hubbert calculated the total amount of crude oil under the surface of the earth and within the U.S. remaining to be extracted. He made the same calculations for natural gas. He also calculated the total amount of crude to be extracted from within the state of Texas. Update: When the production appears to hit a peak, that is the point at which 50% of the resource has been extracted. Future production will be about equal to the sum of actual production and proven reserves at that point.

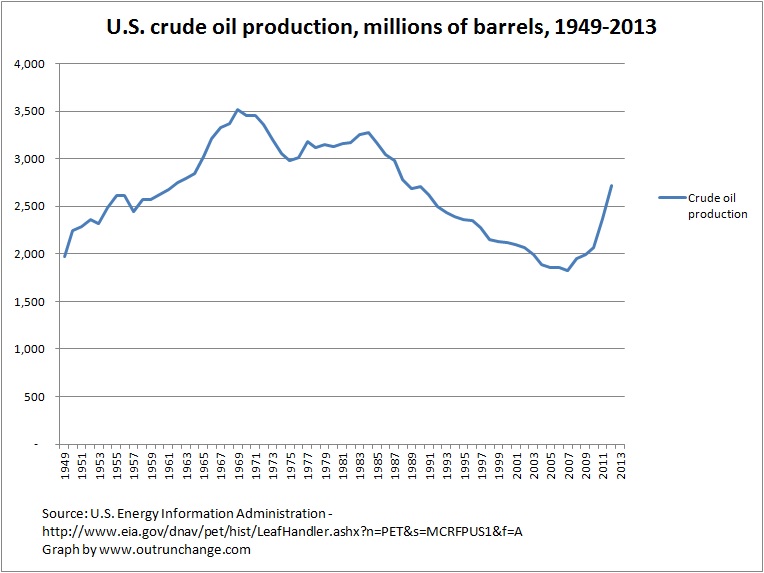
Graphs of Peak Oil production resemble a bell curve with a peak in 1970. His landmark 1956 paper (available here) calculated the amount of total U.S. crude oil production through 2050. The peak of the 200 billion barrel curve is about 1970 with a gradual decline. In about 2010 or 2011, the production level is one-third the peak level.

Don’t take my word for it – see Figure 21.

With that in mind, consider the following graph:


barrels by year 1949-2013

Just a few questions:

If you are new to this discussion, here are a few questions for you to consider:

Continue reading “Encore question: What Peak Oil? – #36”

What Peak Oil? – #35

Update:  Some commenters on the ‘net did not agree with a graph that combines gas and oil. Fair point. I’ll redraw the graph to include only crude oil.

The new graph does not change any comment made in this post. It stands as is.

Peak oil is still a failed concept.

Here is the new graph:

barrels by year 1949-2013


Again, here is the main question: Where is the inverted V drop after the peak that mirrors the runup to the high point?

Answer: It isn’t there.

2nd Update:  I appreciate folks pointing out the error of my ways. Further research produced the above graph which makes the point yet again. I also looked at natural gas production.

The fail of Dr. Hubbert’s theories is even more extremely illustrated by graphing natural gas production. Comparing actual to his predictions is staggering. Another post on Monday.

Two busted Hubbert theories from one post. Peak Gas is even more of a fail than Peak Oil.

3rd update:  Further discussion of the Peak Oil graph on the following post.

Original post:

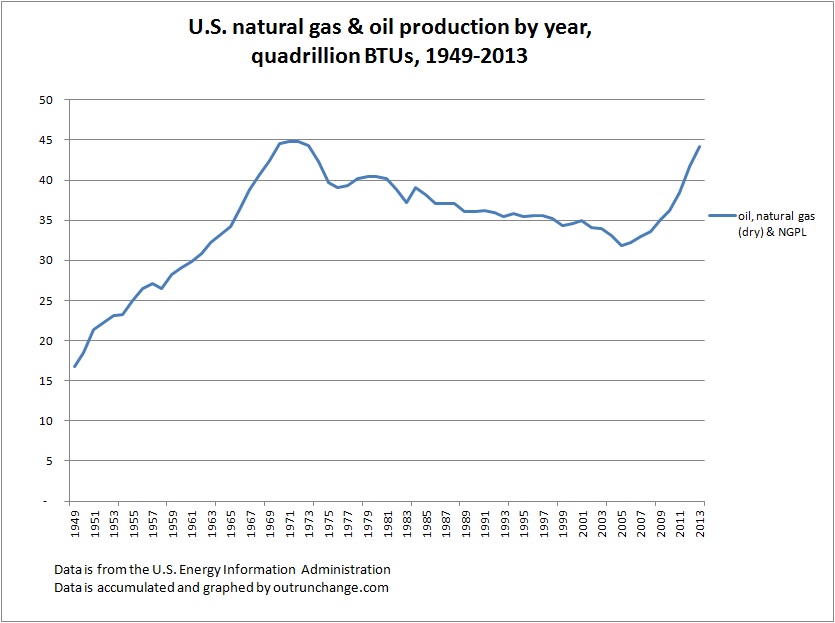
Saw a graph containing production of oil and gas in the U.S. since 1950. Since that one is copyrighted, decided to make my own.

Check out this graph of the amount of crude oil, natural gas (dry), and NGPL from 1949 through 2013:

 oil and gas by year 1949 2013

Now, please look for the permanent, inevitable decline trending to zero after the never-to-be-achieved-again peak oil point of 1970. Also look for the inverted-V shaped drop after the peak that mirrors the runup.

Continue reading “What Peak Oil? – #35”

Update on solar power – 7/25 – solar #22

A few articles on the danger to flying birds, flying planes, and barely-flying economies.

flying birds

Intentional, willful undercounts of toasted wings – 6/25 – ReWire – Panel Discards Scientists’ Recommendation on Wildlife Kills at Solar Plant.

Continue reading “Update on solar power – 7/25 – solar #22”

More good stuff on the Bakken – 7/24

Here’s a few quick notes on interesting news that I won’t cover in a separate post: production levels, a forecast for slowing acceleration of output, employement, infrastructure, and  few other things.

Production level

7/16 – North Dakota oil production passes 1,039,000 BOPD in 5/14

5/30 – Million Dollar Way – That She Is! A Million-Bbl Bakken Well In This Boom – One well has finally crossed the point of producing 1,000,000 barrels of oil. It has been on-line for about 3.5 years. Let’s assume $90/barrel. That would be $90,000,000 gross, or about $26M per year. Still producing 24,000 bbl a month, which at $86 is about $2,000,000 each month. Not even on a pump yet. Initial production was an okay 803 barrels a day. Not great. Not bad. By 12/14, it will have produced $100M of oil.

5/30 – Bakken Shale – Is the Bakken America’s Last Boom?Continue reading “More good stuff on the Bakken – 7/24”

Fire at Williston oilfield supply company

A large fire broke out at Red River Supply, an oilfield supply company in Williston in the early morning hours on Tuesday July 22. First reports of explosions were at about 12:15 in the morning.

Fire officials decided to let the fire burn itself out because of the nearness to the Little Muddy River. Water runoff from fighting the fire would be contaminated with oil and other chemicals which would then drain into the river.

Continue reading “Fire at Williston oilfield supply company”

Update on wind power, 7/22

A few more articles on the damage from wind power. Seems that wind power isn’t good for birds, nearby little mammals, humans, or for reducing net emissions.

Official permission to slice-and-dice golden eagles – 6/26 – ReWire –Feds Set To Issue First Eagle Kill Permit to California Wind FacilityContinue reading “Update on wind power, 7/22”

Short-term and long-term predictions for North Dakota oil production

Production will likely increase 5% or 6% a month for June, July, and August of 2014.

That is the expectation of Lynn Helms, director of N.D. Department of Mineral Resources, in a conference call reported by Bloomberg: North Dakota Expects “Big Surge” in Summer Crude Output.

I’ll turn that into a specific number by combining that with 2% or 2.5% growth through November. Will use that cutoff instead of December, since weather could get bad in either January or December.

Starting point is 1,039,635 bopd in May.

Here’s a range of guesses for November 2014: Continue reading “Short-term and long-term predictions for North Dakota oil production”

North Dakota oil production passes 1,039,000 BOPD in 5/14

Check out this pump working away to bring oil to the surface so you can drive your car. Shaky photography courtesy of James Ulvog.

[youtube=http://youtu.be/3ZYVN_7PG_M]


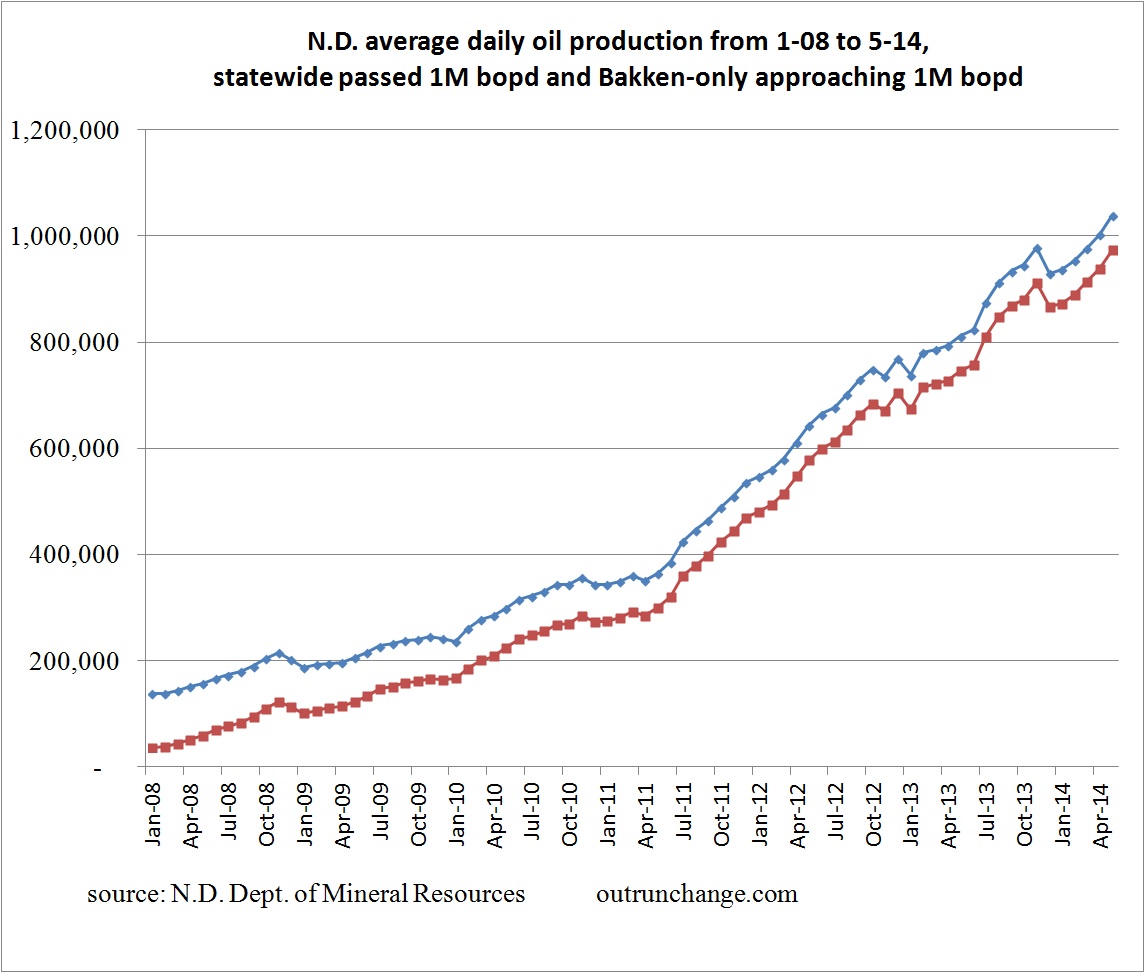
Preliminary production data for the state is 1,039,635 barrels per day average in May 2014. That will be revised up a smidgen over the next two months.

At the average price for the month provided in the Director’ Cut report of $88.31 for 32.2M barrels, that is an economic output of $2.84 billion for the month. Very cool.

Here’s a few graphs:

Monthly production since 2008:

ND production 5-14

Two more  –

Monthly production since 1990:

Continue reading “North Dakota oil production passes 1,039,000 BOPD in 5/14”

A way forward for a better energy future without slice-and-dicers or wing-toasters

If you have read more than, oh, say 5 consecutive posts on this blog, you know that technology in place today for solar and wind power ranks poorly on any scale of value I can think of. Whether I look at the cost of energy, level of environmental damage, devastation to wildlife in general, loss of protected species in particular, general disruption, exorbitant costs, visual pollution, noise pollution, corruption caused by crony capitalism, or damage to cultural artifacts, it is obvious to me that slice-and-dicers and wing-toasters are lousy sources of energy.

What is a better way forward? For the near term, abundant oil and natural gas.

Longer term? I don’t know.

Nobody knows.

And that is the point.

Continue reading “A way forward for a better energy future without slice-and-dicers or wing-toasters”

Update on solar and wind power – 7/2 – solar #21

Here are a few articles on the environmental damage from solar and wind energy.

Oh. And I expect to never hear another word about the horrid amount of water used to drill an unconventional oil well. The Eagle Mountain Pumped Storage Project in Riverside County will initially use as much water as it takes to drill 1,369 fracked wells and in addition for each year for 50 years will draw water sufficient to drill 130 wells.

Wing-toasters, or unknown numbers of streamers

6/17 – ReWire – Bird Deaths Continue Through May at Ivanpah Solar – Number of dead birds at the Ivanpah toasting facility dropped slightly in May to 80 birds and 2 bats.  Scorching, singeing or melting feathers was visible on 44 of the birds. Several had burns on their bodies. Severe impact of not covering the whole facility when looking for birds is described in the article as follows:

As only about 20 percent of the facility is covered by the carcass surveys, it’s reasonable to assume the actual month’s death toll is upward of 300 or so.

Continue reading “Update on solar and wind power – 7/2 – solar #21”

A few records set by North Dakota and the Bakken field

North Dakota has set several records in oil production.

In her article, Amy Dalrymple, N.D. oil production hits 1 million barrels per day reminds us of a few records that I’ve read elsewhere: Continue reading “A few records set by North Dakota and the Bakken field”

What’s it cost to run an oil well for a year?

I’ve been wondering about that. Million Dollar Way quotes some comments from a Google Discussion Group that gives some info: Monthly Costs For Maintaining An Active Well…

Most companies estimate production costs at $6,000 to $8,000 per month per well…or $70,000 to $100,000 per year.

Keep in mind that a majority of wells require a week or more of maintenance each year with a workover rig with support equipment and crew at $10,000 plus per day.

You also have significant power costs in addition to general lease operations. A 6-8 well pad could easily require $750,000 to $1 million per year to keep everything in top condition to maximize production without any major operational downhole problems.

Since I’m an accountant, I’ll convert that background into a specific calculation adding in a few of my assumptions. Continue reading “What’s it cost to run an oil well for a year?”

Predictions for plateau in North Dakota oil production

Think I’ll start accumulating predictions for the highest point of oil production in North Dakota now that the state has passed 1,000,000 barrels per day.

In a feature article, N.D. oil production hits 1 million barrels per day, Amy Dalrymple, provides two estimates: Continue reading “Predictions for plateau in North Dakota oil production”

North Dakota oil production passes the 1 million barrels per day mark in April ’14.

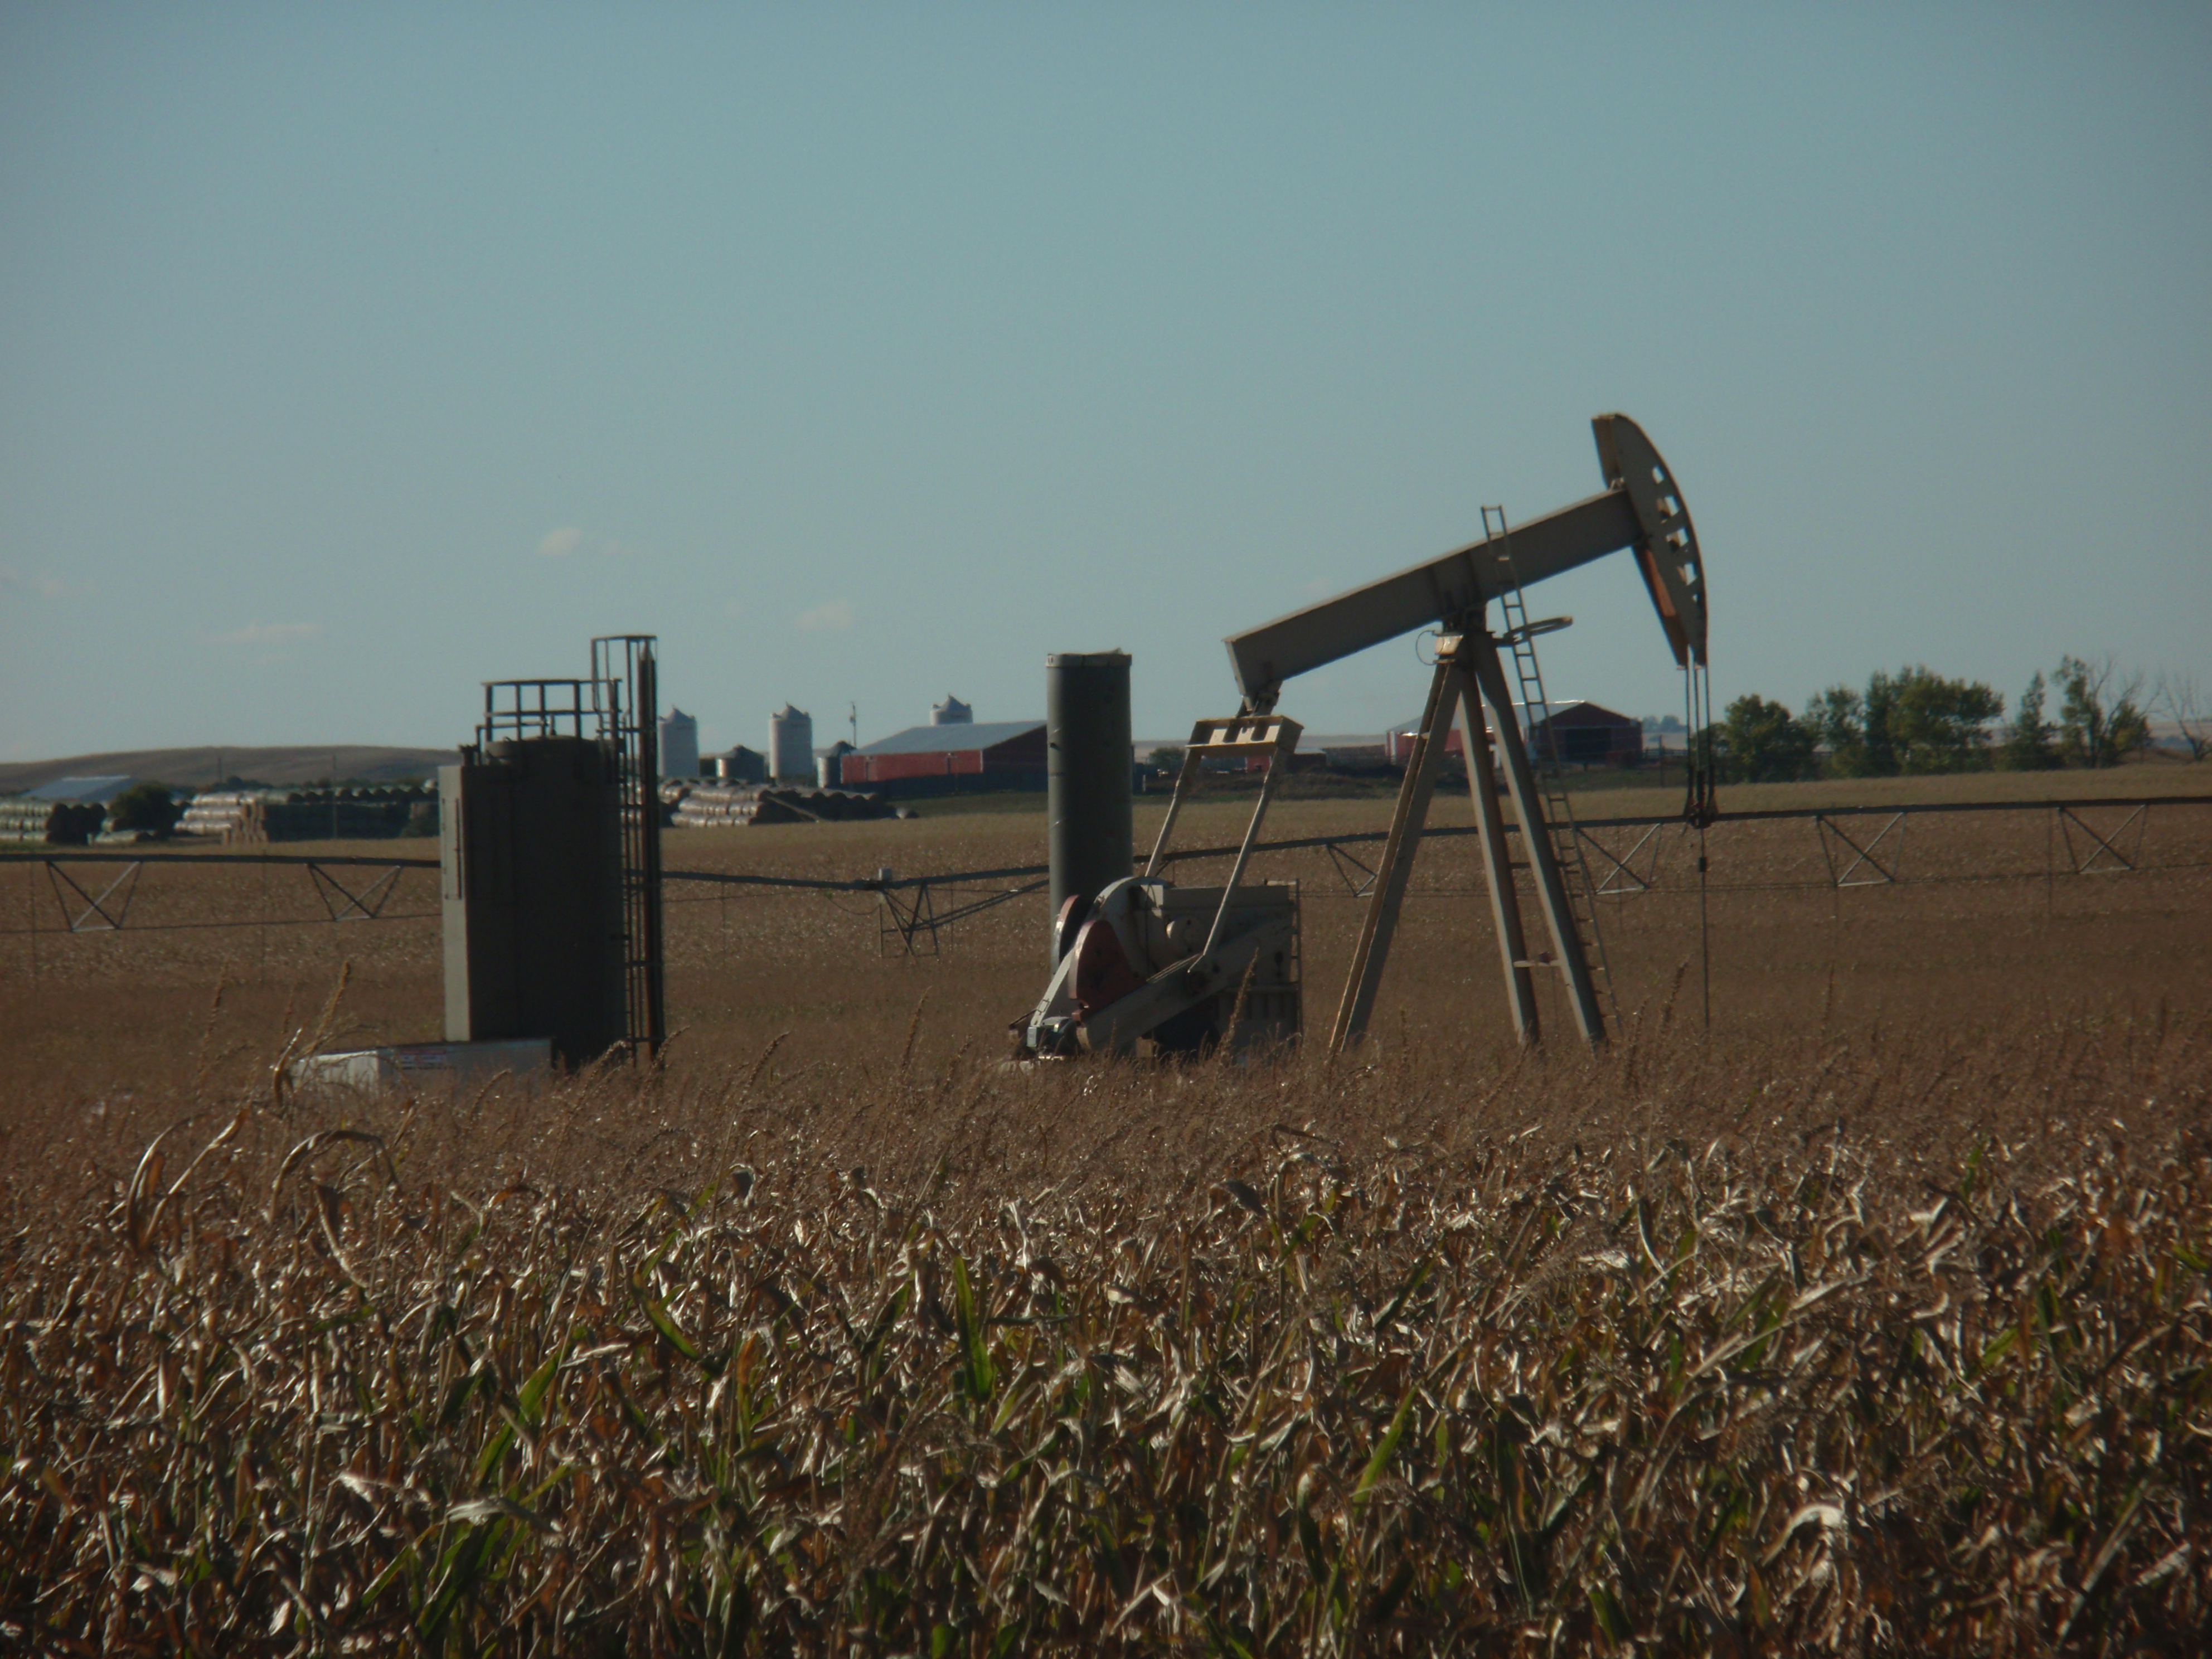
OLYMPUS DIGITAL CAMERA

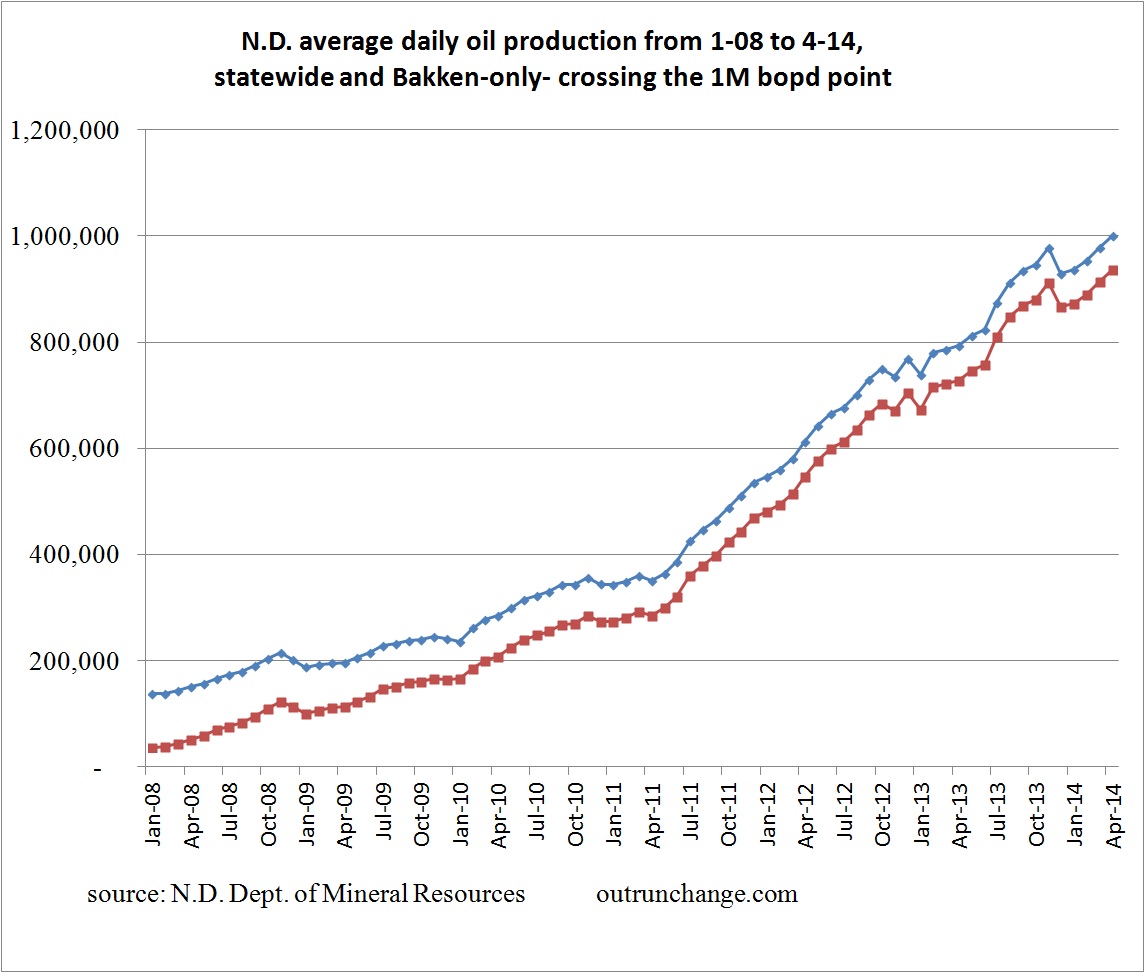
April marked the month that the average production passed the 1 million point. Preliminary number is 1,001,149.

Everyone has been waiting for this day. Yippee!

Here’s a graph of production for state-wide and Bakken-only:

ND production 4-14


Predictions

Continue reading “North Dakota oil production passes the 1 million barrels per day mark in April ’14.”