Productivity of Bakken and Eagle Ford wells

IHS Global Insights has a new study out comparing the productivity of Bakken and Eagle Ford wells. Looks like the wells in Eagle Ford are pumping out more oil. The announcement of the study is at Eagle Ford Shale Drilling Results Compare favorable with Bakken, Says IHS.

Check out this comment on comparative productivity:

Continue reading “Productivity of Bakken and Eagle Ford wells”
Bakken as an illustration of reserve growth – how we find more oil in known fields that appear to be in decline. Peak Oil #8

Does oil just magically appear in a tapped out field or do the oil people learn how large the field really is, locate more oil, and develop new ways to get the oil out of the ground?

If you’ve read this blog for long, you know what I think the answer is.

Look at the monthly production data for the Bakken field, exclusive of wells elsewhere in North Dakota. You can find the data here. This data is for the Bakken, Sanish, Three Forks, and Bakken/Three Forks pools only.

  • December 1953 – One well is online producing 5,429 barrels. That’s for the month. A mere 175 barrels of oil per day (bopd).

Continue reading “Bakken as an illustration of reserve growth – how we find more oil in known fields that appear to be in decline. Peak Oil #8”

Good problems continue – increase in backlog of N.D. wells waiting for fracking crews

The backlog of wells in North Dakota that have been drilled but waiting to be fracked has increased in the last six months.

Last June, I mentioned there were 248 wells waiting for fracking crews.

In the July 2012 Director’s Cut report, Lynn Helms reports there is a backlog of 336 wells.

While that is an increase in numbers, that represents a decrease in the number of months worth of new wells. Let me explain.

Continue reading “Good problems continue – increase in backlog of N.D. wells waiting for fracking crews”

Lifetime financial data for a typical well in Bakken – revised

Previous posts here and here covered some of the info from a presentation by Mr. Lynn Helms, North Dakota’s Director of Mineral Resources, at the Williston Basin Petroleum Conference on May 25, 2012.

The presentation had more information on the dollar impact of a typical well in Bakken. The additional info allowed me to rearrange the data into an income statement. I am an accountant after all.

I previously discussed this in another post. I’ll refine that analysis in this post.

Here is the income statement for a typical well over a full lifetime of production, based on the data in the presentation. Continue reading “Lifetime financial data for a typical well in Bakken – revised”

Graph of North Dakota oil production – another record – May 2012

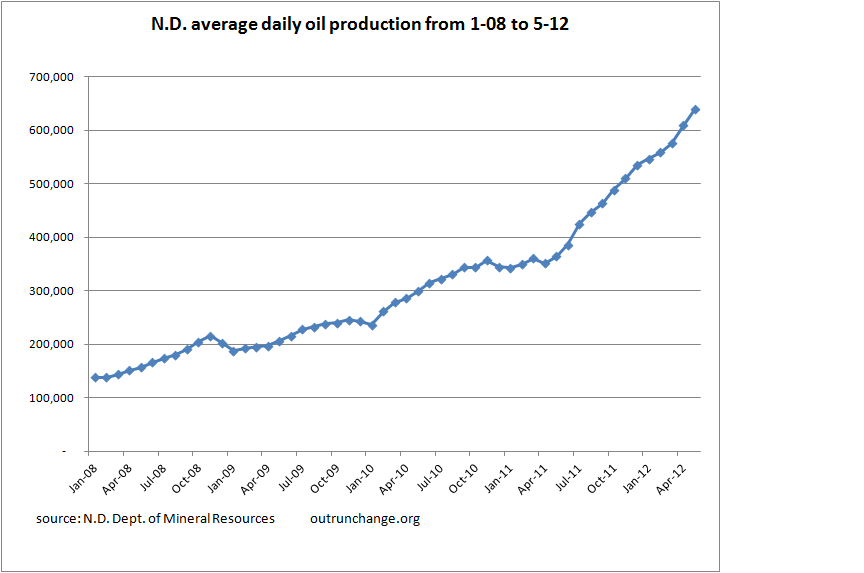
Average daily oil production in North Dakota for May 2012 was 639,277 bopd, which is an increase of 29,904 barrels per day over April, or 4.9%.  The April increase was 33,883 bopd, or 5.9% for the month. Increase in March was 17,235 bopd, or 3.1% over February.

Number of wells increased to 6,954.

You can find the data here.

Here is a graph of monthly production:

For some longer term perspective, here is the production data for the month of May over the last 5 years. Continue reading “Graph of North Dakota oil production – another record – May 2012”

Forecasts for Bakken field. Part 2

Previous post covered some of the info from a presentation by Mr. Lynn Helms, North Dakota’s Director of Mineral Resources, at the Williston Basin Petroleum Conference on May 25, 2012. You can find the PDFs from the presentation here.

Here is some more info I enjoyed from the presentation.

Possible number of new wells in North Dakota

Continue reading “Forecasts for Bakken field. Part 2”

Forecasts for Bakken field. Part 1

Wow. I tripped across the PDF slides for the presentation by Mr. Lynn Helms, North Dakota’s Director of Mineral Resources, at the Williston Basin Petroleum Conference on May 25, 2012. You can find the presentation on this page. The title is WBPC Activity.

A big thank you to Mark J. Perry at Carpe Diem for pointing me to the PDF slide presentation.

Mr. Helms presentation is the source for many of the articles I’ve read and the resulting posts on this blog.

What is the very condensed message from the presentation?

The oil boom in North Dakota, which has seen production skyrocket to over 600,000 barrels per day, is just getting started.

Typical production from a well

Continue reading “Forecasts for Bakken field. Part 1”

ND oil production 1M bopd by 2015 or 2019

I’m going to start accumulating estimates of when North Dakota oil production will pass the 1 million barrels per day mark.

Prairie Business reports in ENERGY: 1 million barrels possible an estimate that ND production will be 1M bopd by 2015.  James Volker, chairman and CEO of Whiting Petroleum Corp., makes that prediction.

A plateau of 800K bopd is more likely, according to Alison Ritter, public information specialist for the North Dakota Department of Mineral Resources.  According to the article:

Ritter adds that the department sees the 1 million barrels per day as a possible scenario. The probable scenario is 800,000 barrels a day.

3 scenarios for production

Continue reading “ND oil production 1M bopd by 2015 or 2019”

Back of the envelope calculation for the total drilling investment per month in Bakken and the possible revenue over the next year

Here is a wild guess on what a month’s worth of production might cost and the value of oil produced in the next 12 months for the Bakken field.

The drillers are investing far more than a billion dollars per month. My estimate is the new wells drilled in one month will produce gross revenue for the next year’s production in the range of 1 billion or 3 billion dollars.

Continue reading “Back of the envelope calculation for the total drilling investment per month in Bakken and the possible revenue over the next year”

Graphs of North Dakota oil production – April 2012

Here’s a few graphs of North Dakota oil production.

Click on any graph to enlarge.

Average daily production by month:

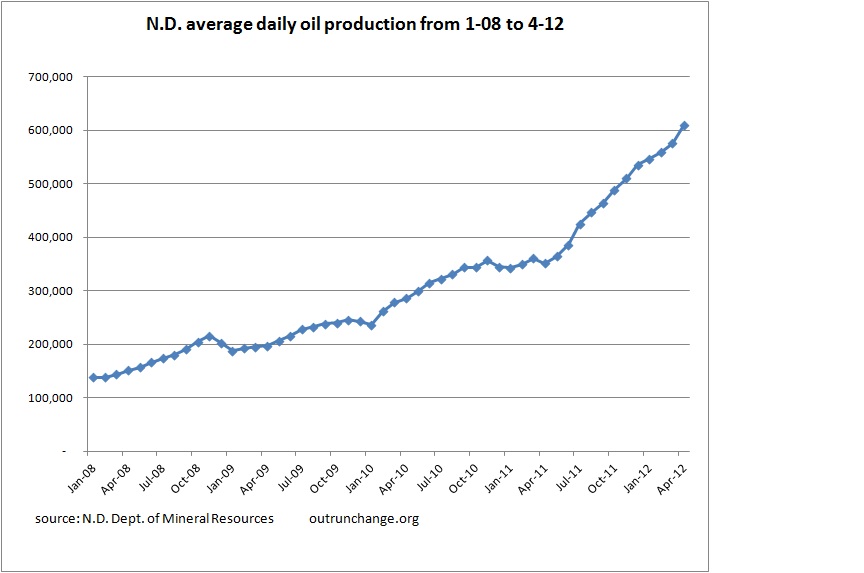
Annual average of daily production (calculated as total production for the year divided by 365, except for 2012 which is divided by 121): Continue reading “Graphs of North Dakota oil production – April 2012”

North Dakota oil production passes 600,000 barrels per month, pulling ahead of Alaska by a smidgeon

April production averaged 609,373 barrels per day. That is up 33,883 bopd from March. Number of producing wells is 6,734, which is an increase of 93 for the month.

Stats on oil production from the North Dakota Department of Mineral Resources are here.

Production data from Alaska can be found here.

With April production in Alaska of 18,210,000 barrels for a 30 day month that is an average of 607,000 per day. That means production in North Dakota is very slightly ahead of production in Alaska.

Continue reading “North Dakota oil production passes 600,000 barrels per month, pulling ahead of Alaska by a smidgeon”

How long to hit a million barrels a day in North Dakota oil production?

I’ll make a wild guess when production of oil in North Dakota will hit one million barrels a day.  I’ll put my estimate on the table.

Before September 30, 2013.

I’ve not seen any projections on Bakken production that were not extremely understated in light of what happened since the estimates were made.

Continue reading “How long to hit a million barrels a day in North Dakota oil production?”