Survey of shale oil; also the Peak Oil Myth – #26

Matt Ridley provides an overview of the flood of fracked shale oil in his post, The dash for shale oil will shake the world.

He points to The Shale Oil Boom: a US Phenomenon, a newly released report from Leonardo Maugeri.

I’ve mentioned this in the past, but look again at the explosion of estimated recoverable oil in Bakken: Continue reading “Survey of shale oil; also the Peak Oil Myth – #26”
2 graphs that show how dramatically oil production has increased in the U.S.

Carpe Diem has two graphs that give a visual on how much the energy field has changed in a very short time.

Check out the first one – More on the spectacular rise in Texas oil production — maybe the most remarkable energy success stories in US history

The smoothed red lines are amazing. Slow decline in production from 1985 to about 2003. Flat production until about 2011. Then a space shuttle imitation. Almost, but not quite straight up for the last two years or so. Since 2010 or 2011, production in Texas has soared back to 1985 levels.

Now look at the second graph. The article title tells the story: No. 1 US produced more petroleum in March than: a) Saudi Arabia, and b) Europe, Central and South America combined.

Continue reading “2 graphs that show how dramatically oil production has increased in the U.S.”

How much has oil production increased in Texas over the last 16 months? 1 Bakken. (I think that’s a unit of measure, by the way.)

I’m starting to get a kick out of the idea that we measure humongous amounts of oil in terms of Bakkens.

Here’s the latest example, in terms of explaining the magnitude of what’s happening in Texas:

In just the last 16 months since October 2011 when the state produced 1.598 million bpd, Texas oil output has increased by almost 700,000 bpd to 2.295 million bpd in February, which is the equivalent of adding an entire new oil field the size of the North Dakota Bakken formation to the US oil supply (based on February production in the Bakken of 715,000 bpd).

Output increase in Texas over 18 months equals one Bakken.

That’s point number 3 at Carpe Diem’s post explaining The meteoric rise in Texas oil output continues and is one of the most remarkable energy success stories in US history.

Continue reading “How much has oil production increased in Texas over the last 16 months? 1 Bakken. (I think that’s a unit of measure, by the way.)”

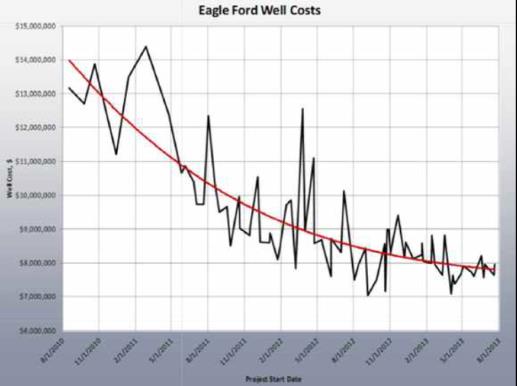
Dropping production costs in Eagle Ford mentioned in 2013 Eagle Ford Impact Report

I mentioned the dropping costs of production in Eagle Ford in this post.

Here’s the graph in the presentation slide deck for the 2013 report from the University of Texas San Antonio:

Eagle Ford production costs

Thanks to R.T. Dukes of EagleFordShale.com for permission to repost his graph. Thanks to Professor Thomas Tunstall for a copy of the slide presentation.

Continue reading “Dropping production costs in Eagle Ford mentioned in 2013 Eagle Ford Impact Report”

2013 Impact of the Eagle Ford Shale field

The University of Texas San Antonio released their 2013 study of the impact of drilling in Eagle Ford. You can get the full report here.

I’ve read through the slide deck for the presentation on 3-28-13. Here a few cool things I think are highlights:

Check out the explosion in drilling permits: Continue reading “2013 Impact of the Eagle Ford Shale field”

Economic impact of Eagle Ford – $61 billion – 2013 report

The University of Texas San Antonio released today their 2013 study of the impact of drilling in Eagle Ford.

I’ll have comments on the report in the next few days. It is a great report.

You can get the report here. If you want more details, the appendix is here.

Continue reading “Economic impact of Eagle Ford – $61 billion – 2013 report”

The energy frontier is open – Texas edition

The western part of North Dakota is not the only place in the country where every business is looking for help. The same thing is happening in the Eagle Ford and Permian fields in Texas.

Check out Bloomberg’s Eagle Ford Shale Boom Fuels ‘Madhouse’ in South Texas Counties report.

Previously closed businesses have reopened. Just about every store in town has a ‘help wanted’ sign.

Here are a few predictions or estimates for the Eagle Ford and Permian field production levels: Continue reading “The energy frontier is open – Texas edition”

Cost and time savings from pad drilling

I’m sure there is data around for how much pad drilling improves operations, but I’ve not seen a specific report like this.

The concept is that drilling multiple wells from one pad makes everything easier. The drillers don’t have to disassemble all the drilling equipment and can instead just side-step the rig. I discussed that in my post here. You can see a video of a rig side-stepping here.

Million Dollar Way has multiple posts over recent months talking about 6, 8, or 12 wells on one pad.

Eagle Ford Shale provides some hard numbers from one specific company:  Pioneer Natural Resource Expanding Use of Pad Drilling in 2013. Check this out:

Continue reading “Cost and time savings from pad drilling”

Eagle Ford crude production likely passing the 400k bopd point in November ’12

I’m having difficulty tracking production levels in Eagle Ford. Haven’t figured out how to read the Texas Railroad Commission’s data (they regulate oil drilling in addition to the rails). Caught on to the North Dakota data a while ago, but that is easier since about 91% of the state’s oil production is from the Bakken field.

One thing I’ve learned is the data comes in slow. Thus it is revised a few times over the next several months after the first data is released.  This is a good thing – the regulators release data as they get it. 

Continue reading “Eagle Ford crude production likely passing the 400k bopd point in November ’12”

Timelapse view of drilling a well

Very cool video from Marathon Oil. Their description:

This timelapse video shows the drilling and fracking of a typical Marathon Oil well in the Eagle Ford, Texas. It was captured in the summer of 2012.

[youtube=http://www.youtube.com/watch?feature=player_embedded&v=6_j7UkuzJTU#t=47s]

link if needed:  http://www.youtube.com/watch?feature=player_embedded&v=6_j7UkuzJTU#t=47s

Hat tip – Carpe Diem

Huge oil fields visible from space at night

Yeah, the lights on all those drilling sites make Bakken and Eagle Ford fields visible from space.

Check out two cool photos at New NASA satellite photos show America’s oil fields at night, over at Carpe Diem.

Cool pix. You can  pick out the interstate highways by tracing the visible towns that are in a line.

Another view of Eagle Ford is at Eagle Ford Shale. It’s not larger than either Houston or Dallas-Forth Worth.  The field is narrower but much more extended than either of those metro areas. Check out Have You Seen the Eagle Ford From Space?

More background on huge Eagle Ford field

Check out the graph of production in Texas, which shows output …

roughly doubled in just the last three years, from 1.08 million barrels of output per day in September 2009 to 2.05 million barrels per day in September of this year.

That observation and cool graph is from Prof. Perry’s post Eagle Ford Shale: the most profitable oil field in the world with dozens of “monster wells” producing up to 5,000 bpd.

He points to another article by Jennifer Hiller, Finding the sweet spots of the Eagle Ford at Fuel Fix blog.

Two fun tidbits from the post.

Continue reading “More background on huge Eagle Ford field”